.webp?language=en-US)


Particulate Matter Mitigation Through Urban Green Infrastructure: Research on Optimization of Block-scale Green Space
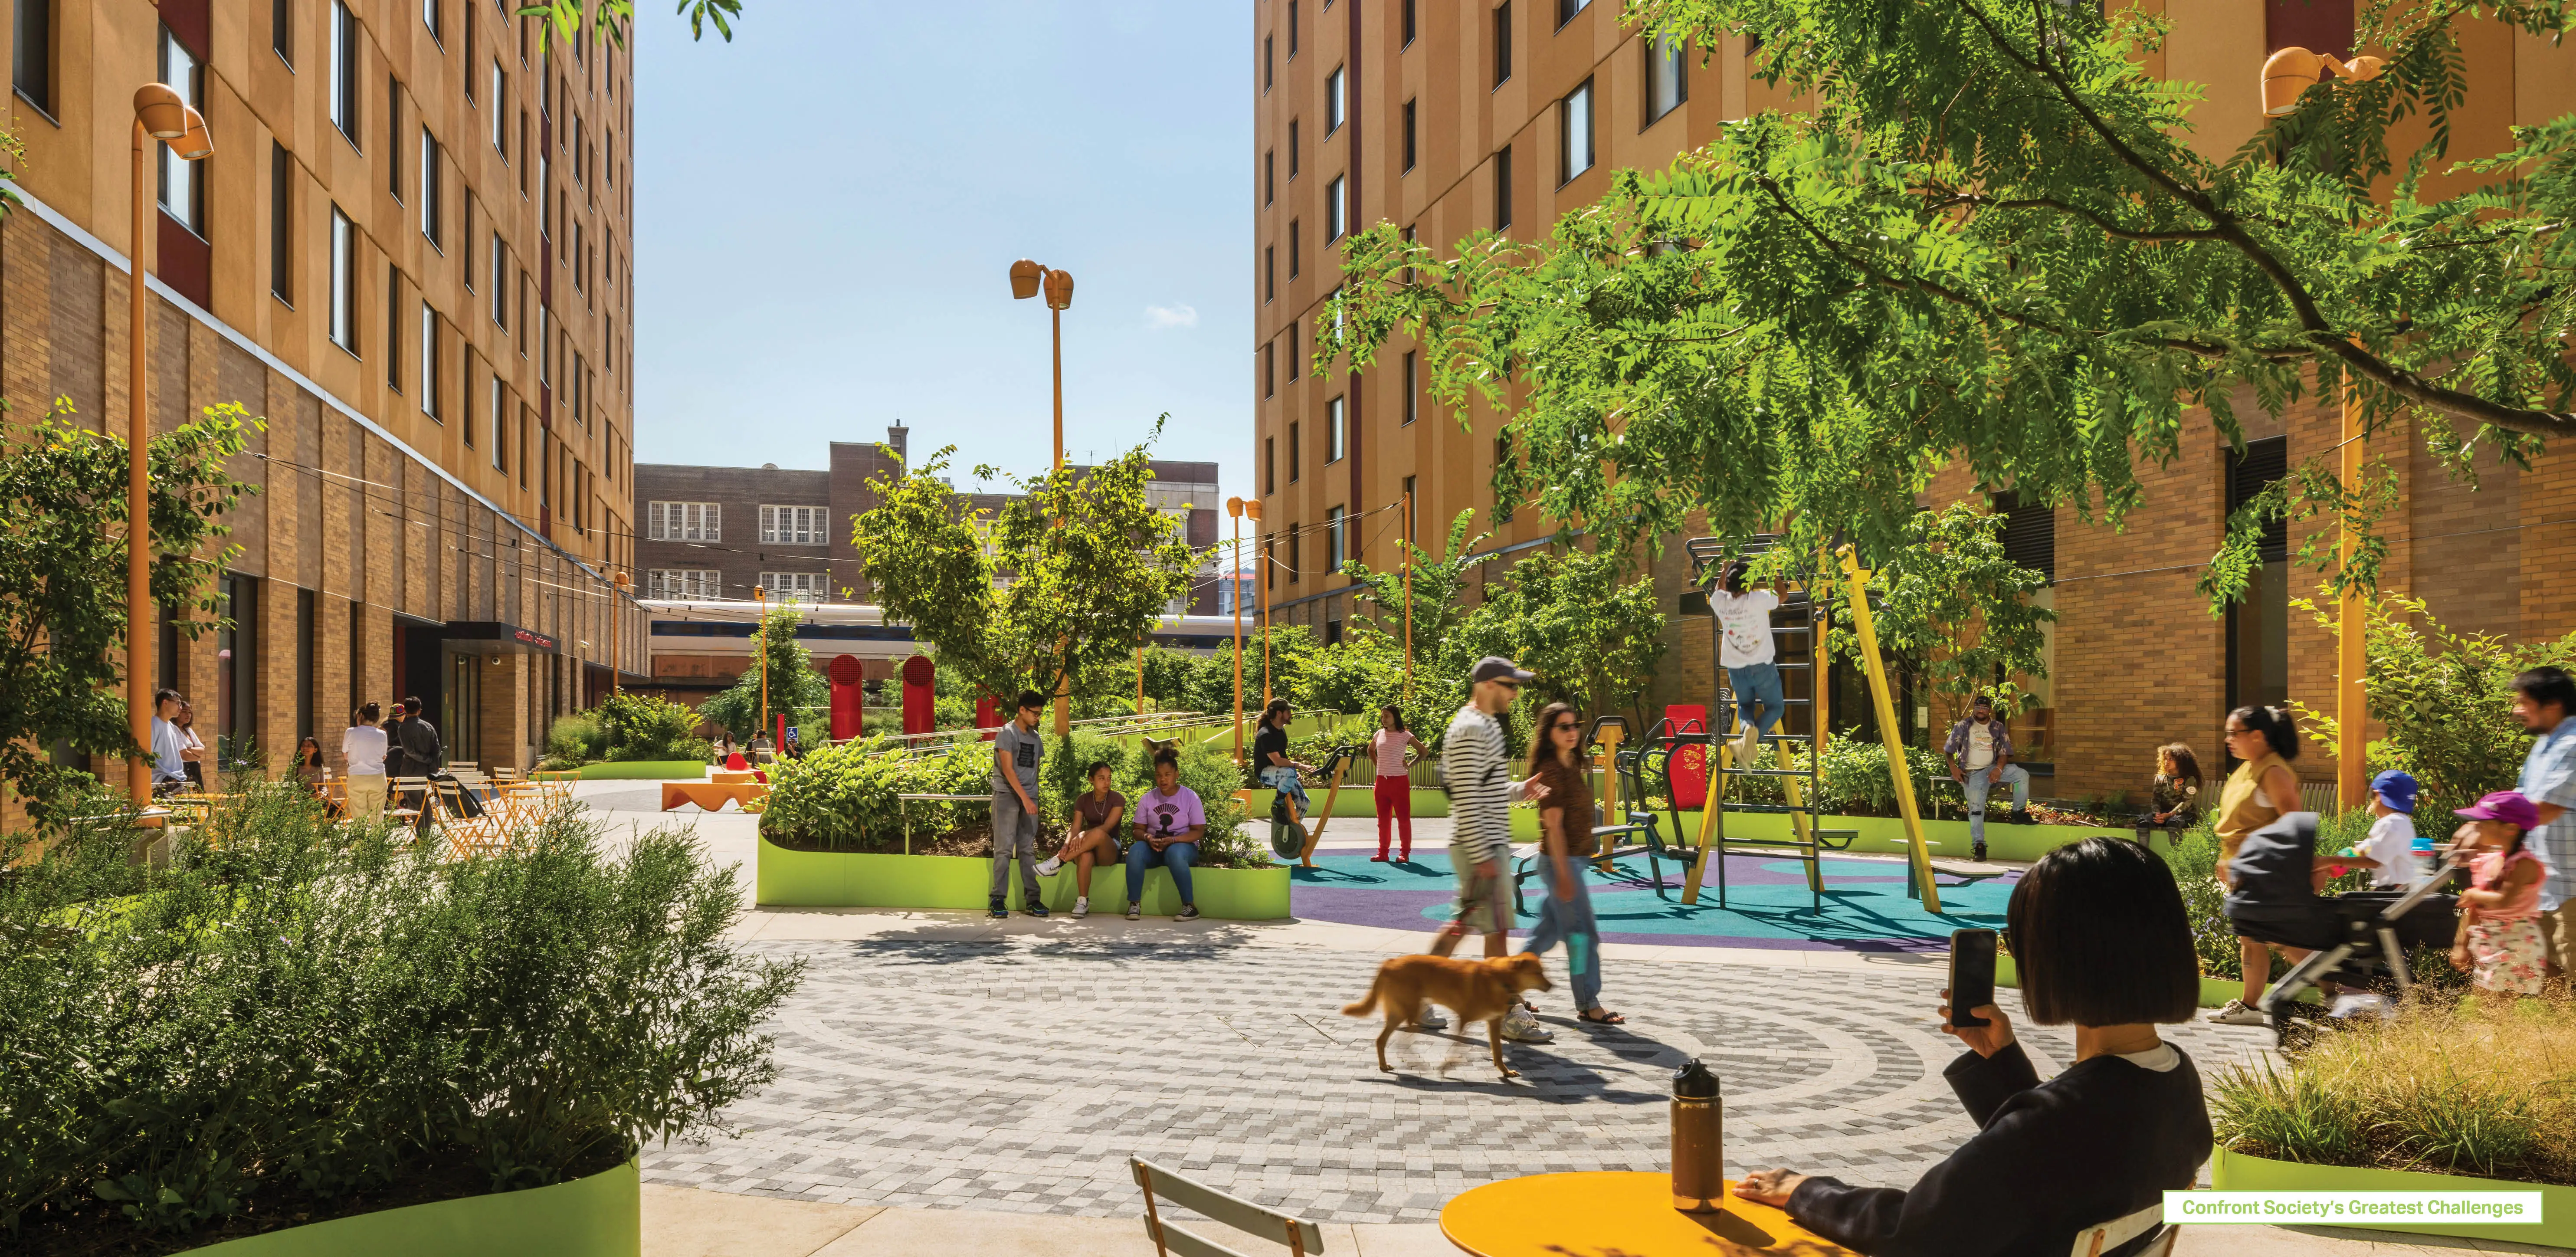
At the hyper-local level, block-sized green spaces have proven effective at reducing pollutants in the form of airborne particulate matter. A long-term air quality study of 37 sites spread across five cities in China found three strategies for improving air quality: creation of pocket parks in available land; planting of developed land through rooftop intervention and vertical greening; and connecting smaller planted parcels to each other to create larger, more continuous greenways. Within a block, the greatest air quality improvements came increasing green coverage to roughly 30 percent; the more of these blocks are stitched together, the better the overall air quality impact.
Awards Jury
-
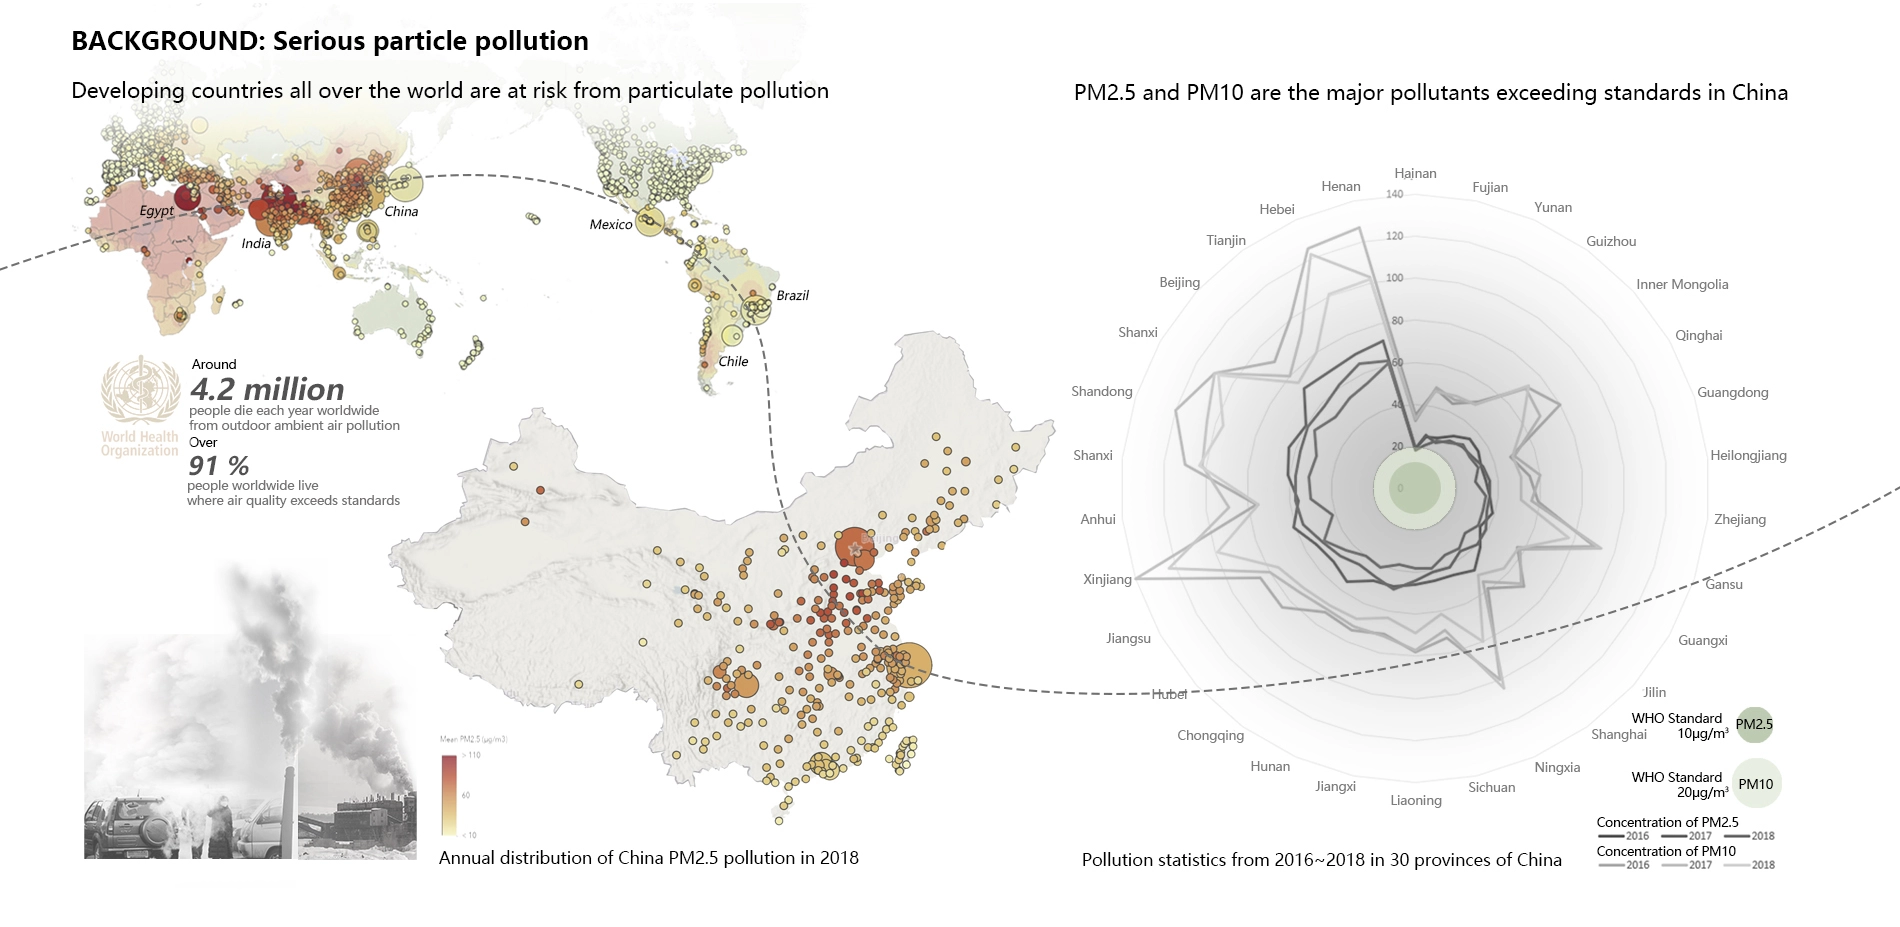
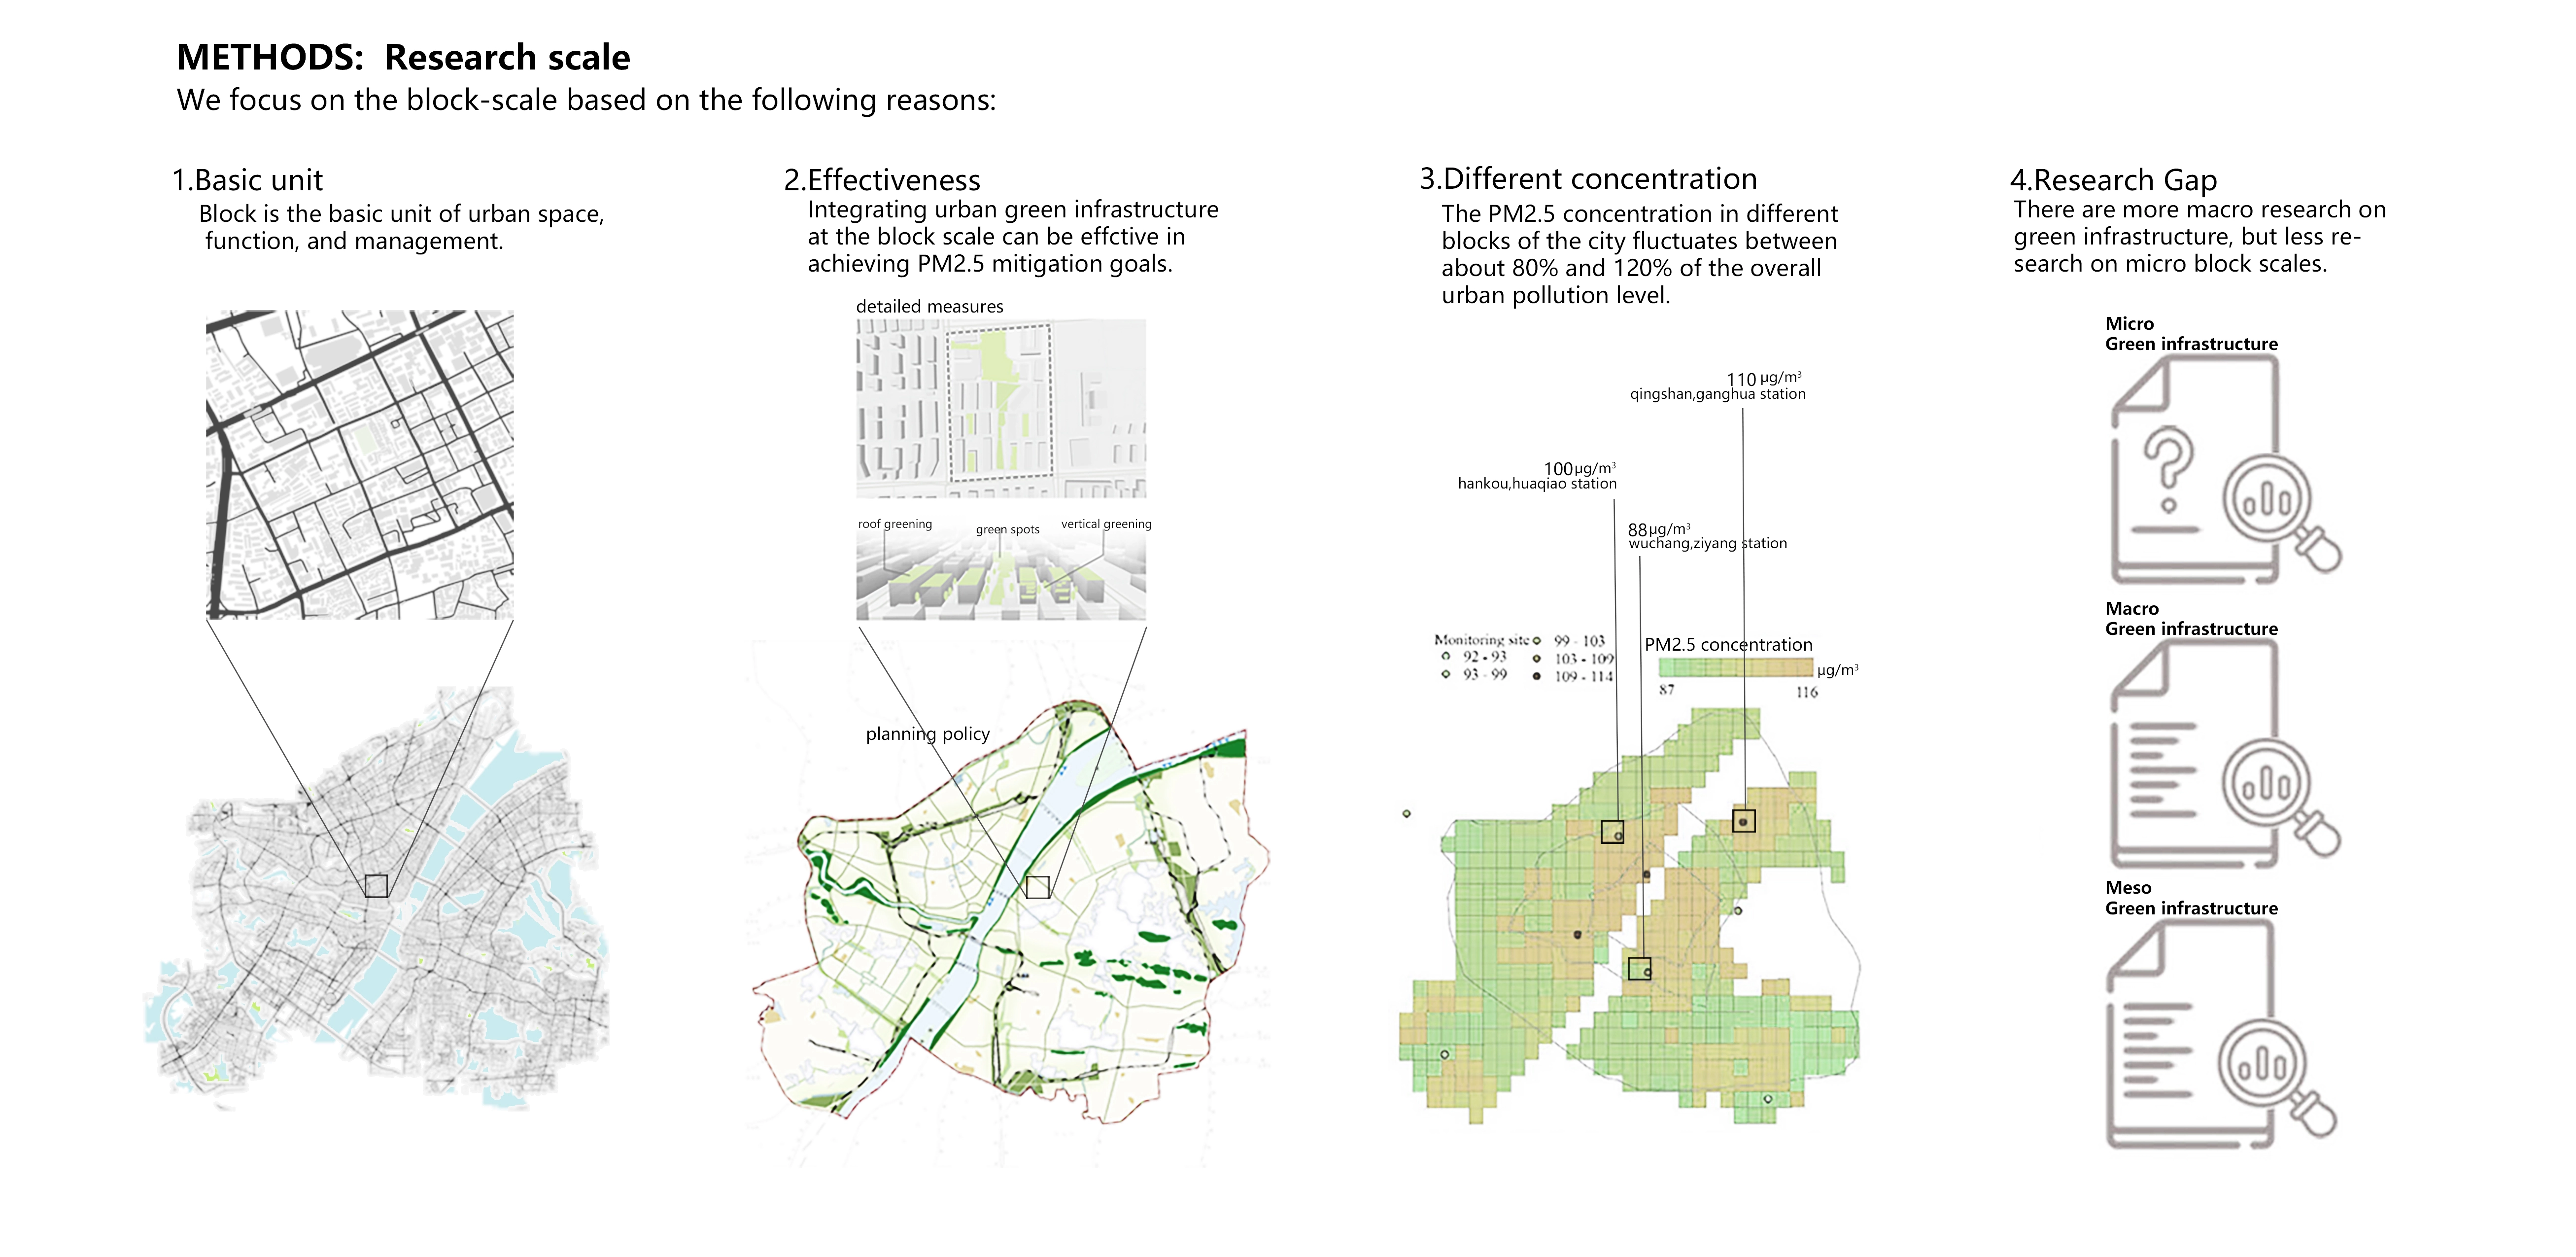
According to the World Health Organization, 91% of the world’s population lives in an environment that has excessive air particle pollution, and particulate matter with a smaller particle size (i.e., PM2.5) is the main pollutant. Previous studies suggested that urban green infrastructure is effective in mitigating PM2.5, while there are significant differences in PM2.5 concentration at the urban block scale. Because block is a central element of urban design, designing green infrastructure at the block scale can be effective in achieving PM2.5 mitigation goals.
We analyzed the quantity (e.g., area) and quality of green infrastructure design (e.g., spatial configuration) in five metropolitan areas in China, including correlation analyses of landscape design metrics and long-term PM2.5 data, and we further developed optimized green infrastructure design strategies. Last, we applied these strategies in a typical urban district and modelled the green infrastructure performance. In summary, this study provides strong evidence that green infrastructure design at the block scale is effective in improving air quality. Other countries that face similar air quality challenges can benefit from this research. -
1. Research background
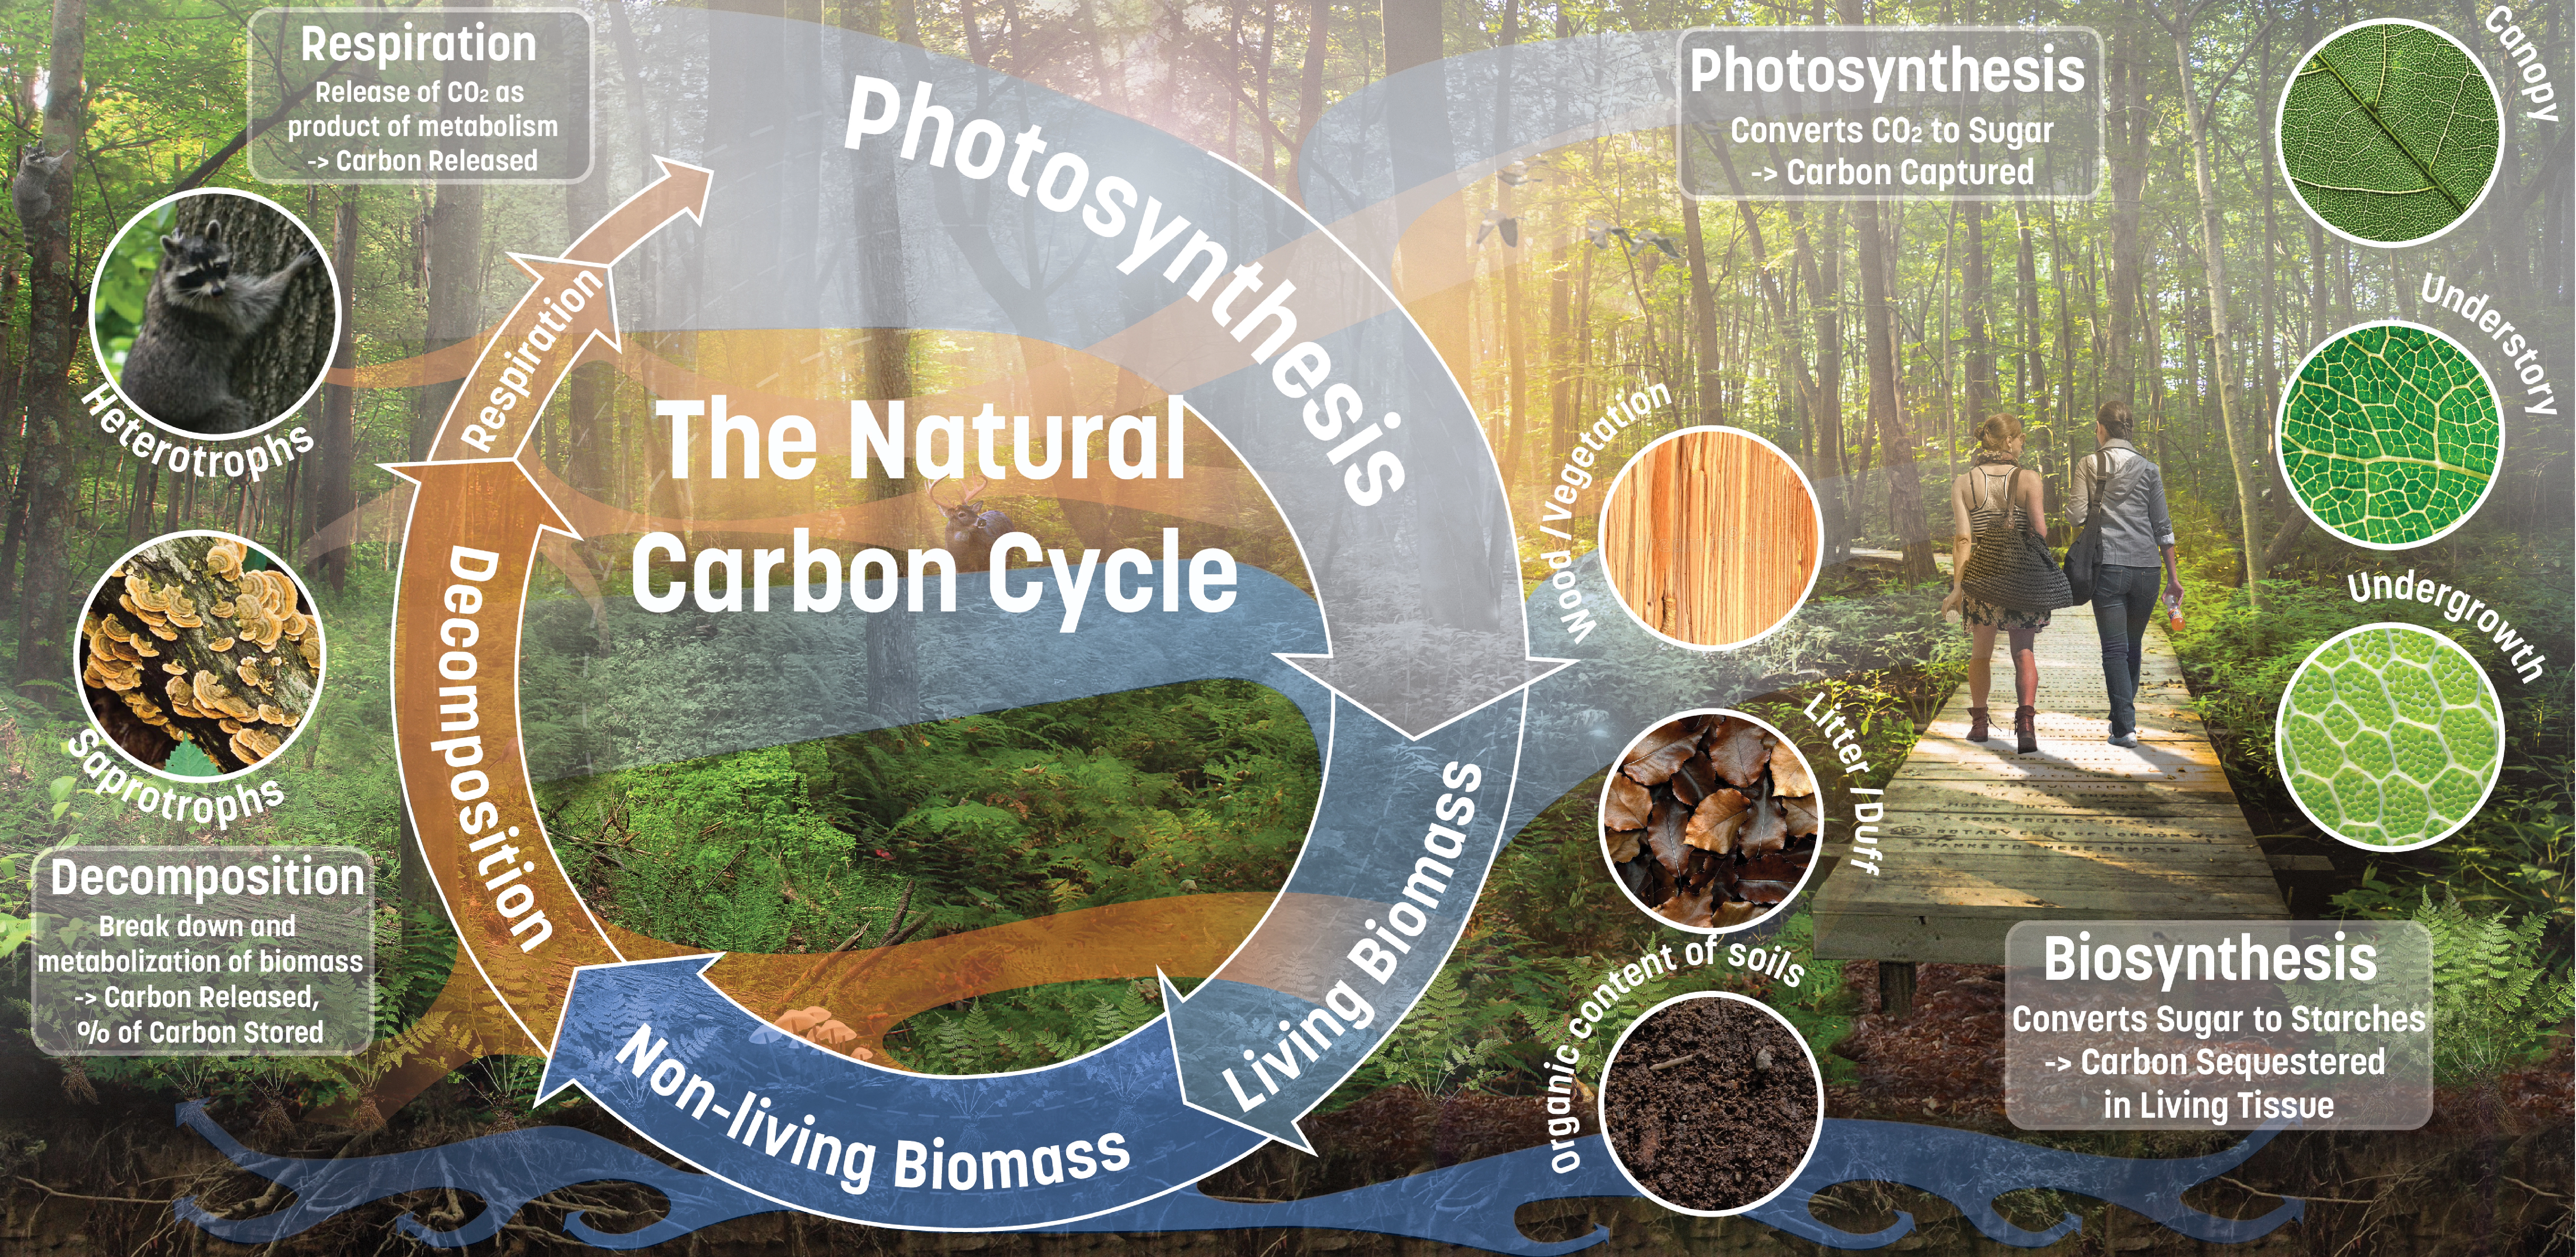
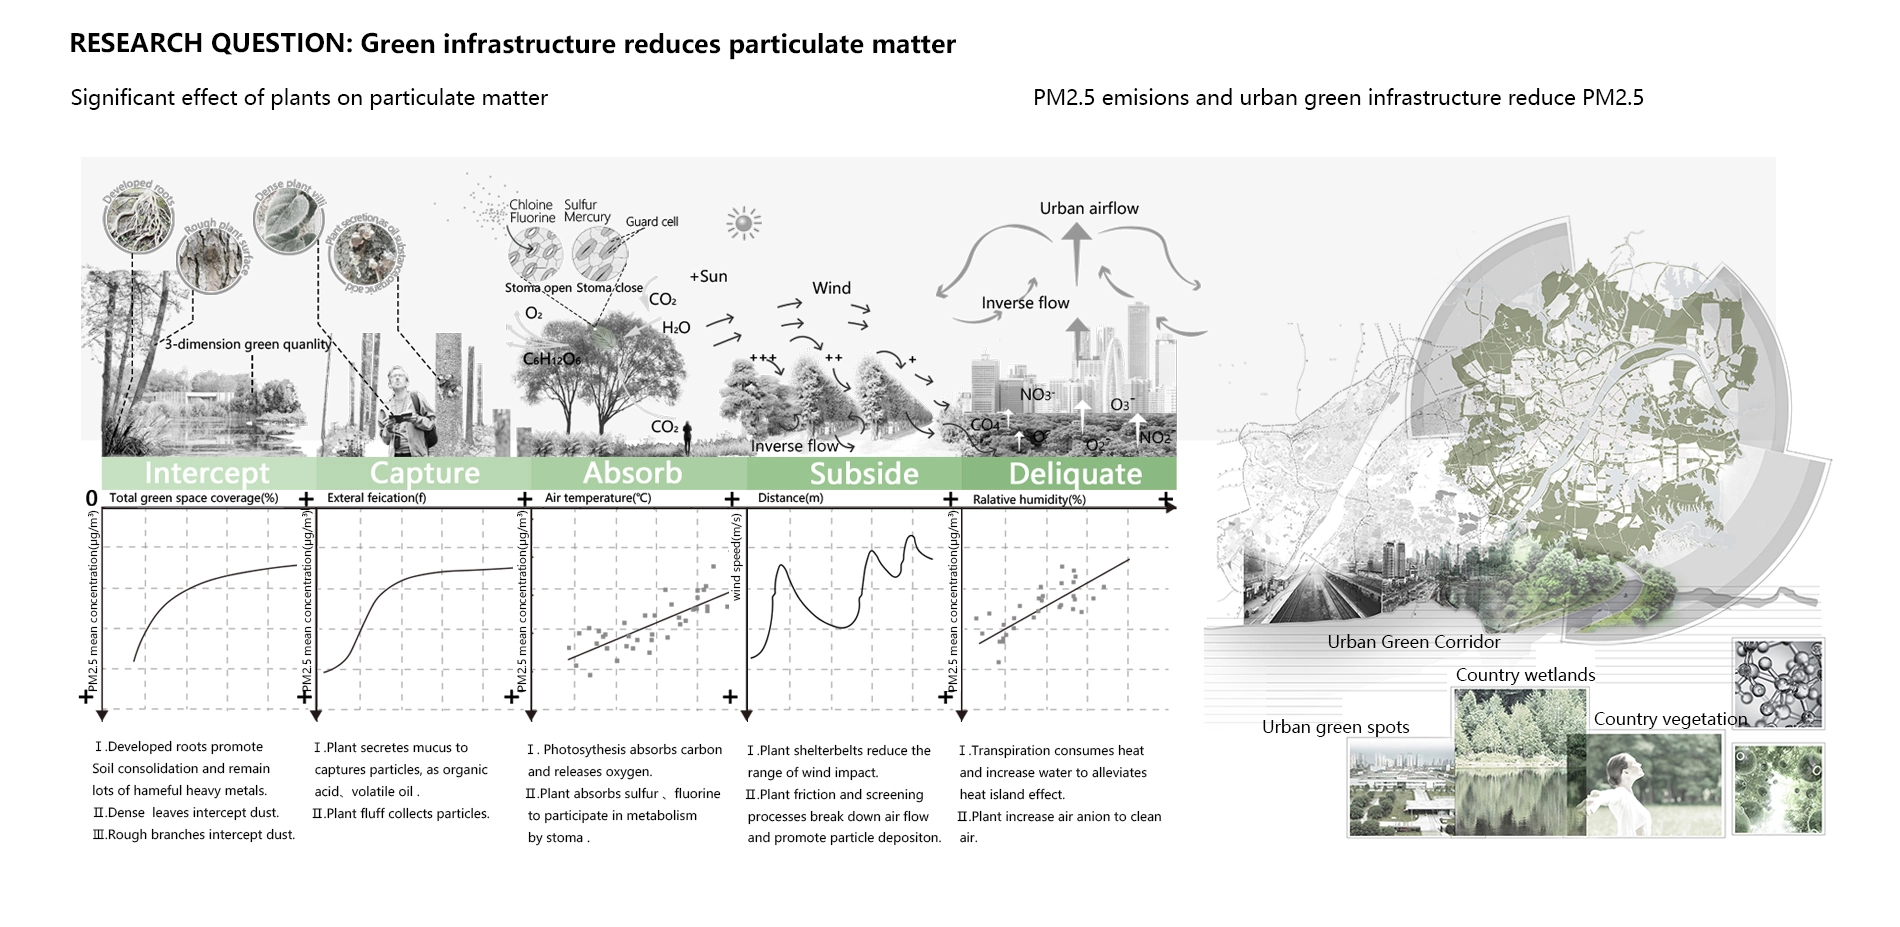
According to the World Health Organization, 91% of the world’s population lives in an environment that has excessive air particle pollution, which condition seriously threatens people’s health. Particular matter with a smaller particle size (i.e., PM2.5) is the main pollutant, especially in developing countries. Previous studies have shown that urban green infrastructure in various forms of designed landscapes are effective in mitigating PM2.5 through sedimentation, retardation, and absorption functions provided by plants. Through analyzing long-term monitoring data, this current study found that PM2.5 concentration can vary significantly among different urban blocks, ranging from 80% to120%. Because block is a central element of urban design, planning and design at the block scale can be effective in achieving PM2.5 mitigation goals.
2. Research methods
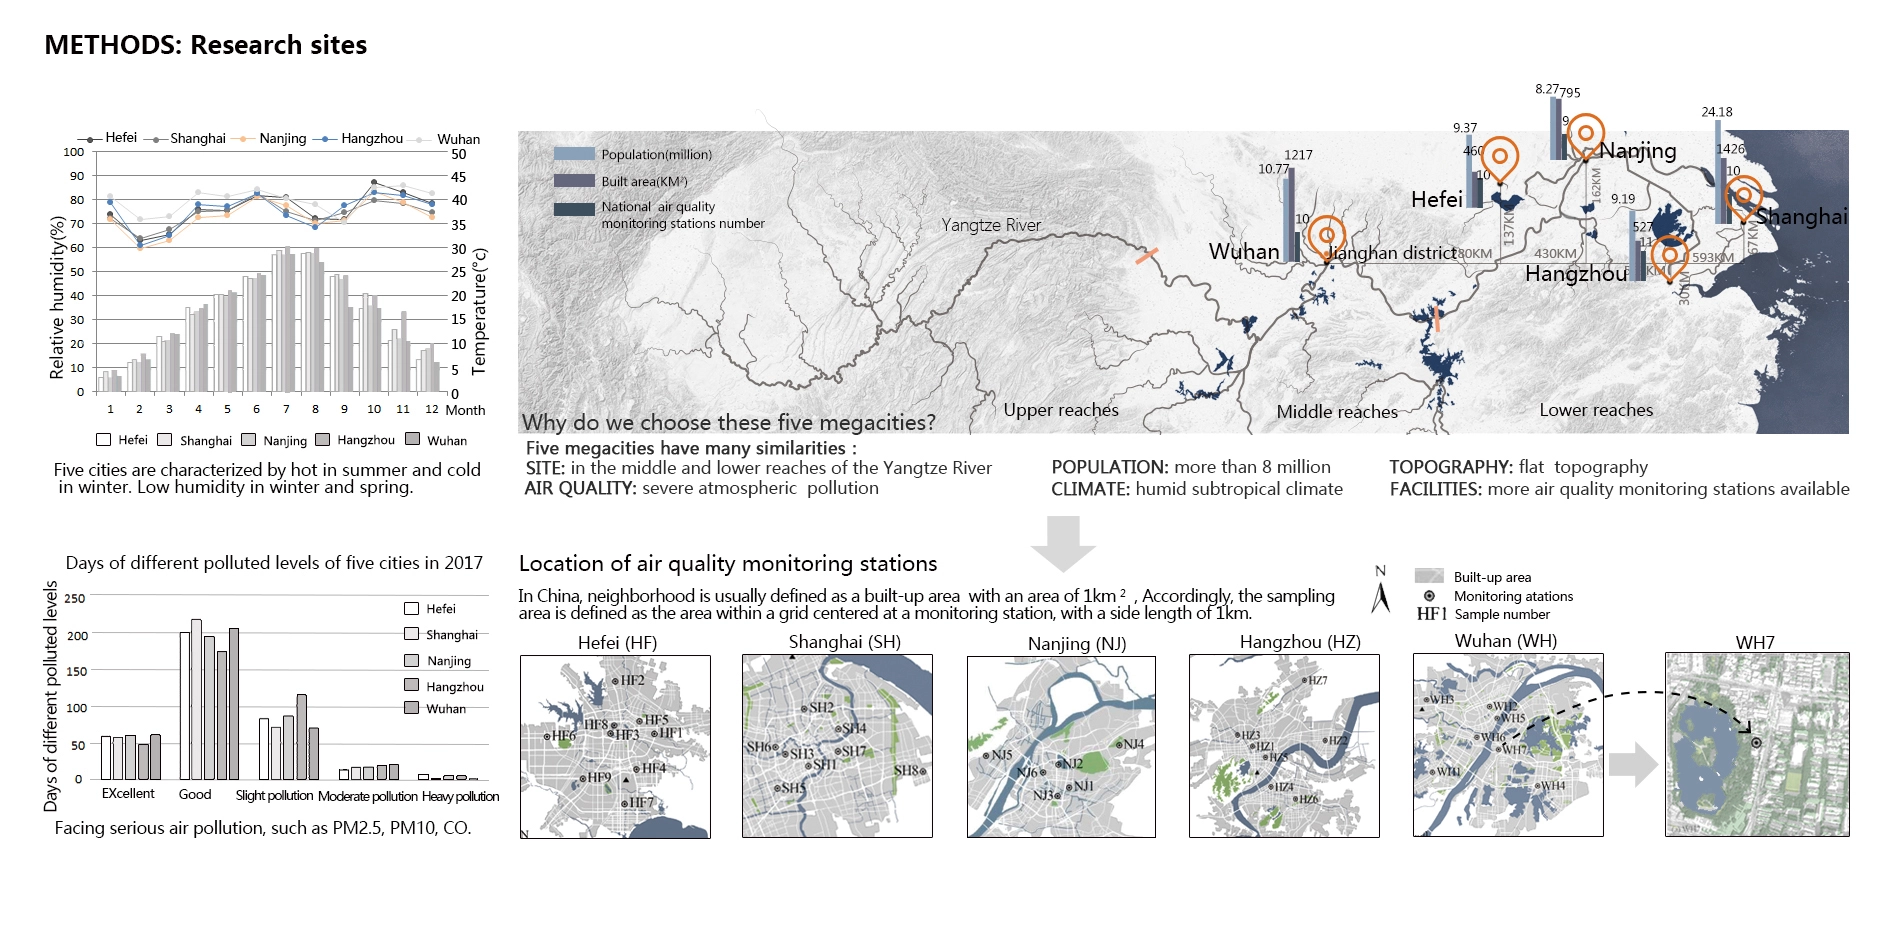
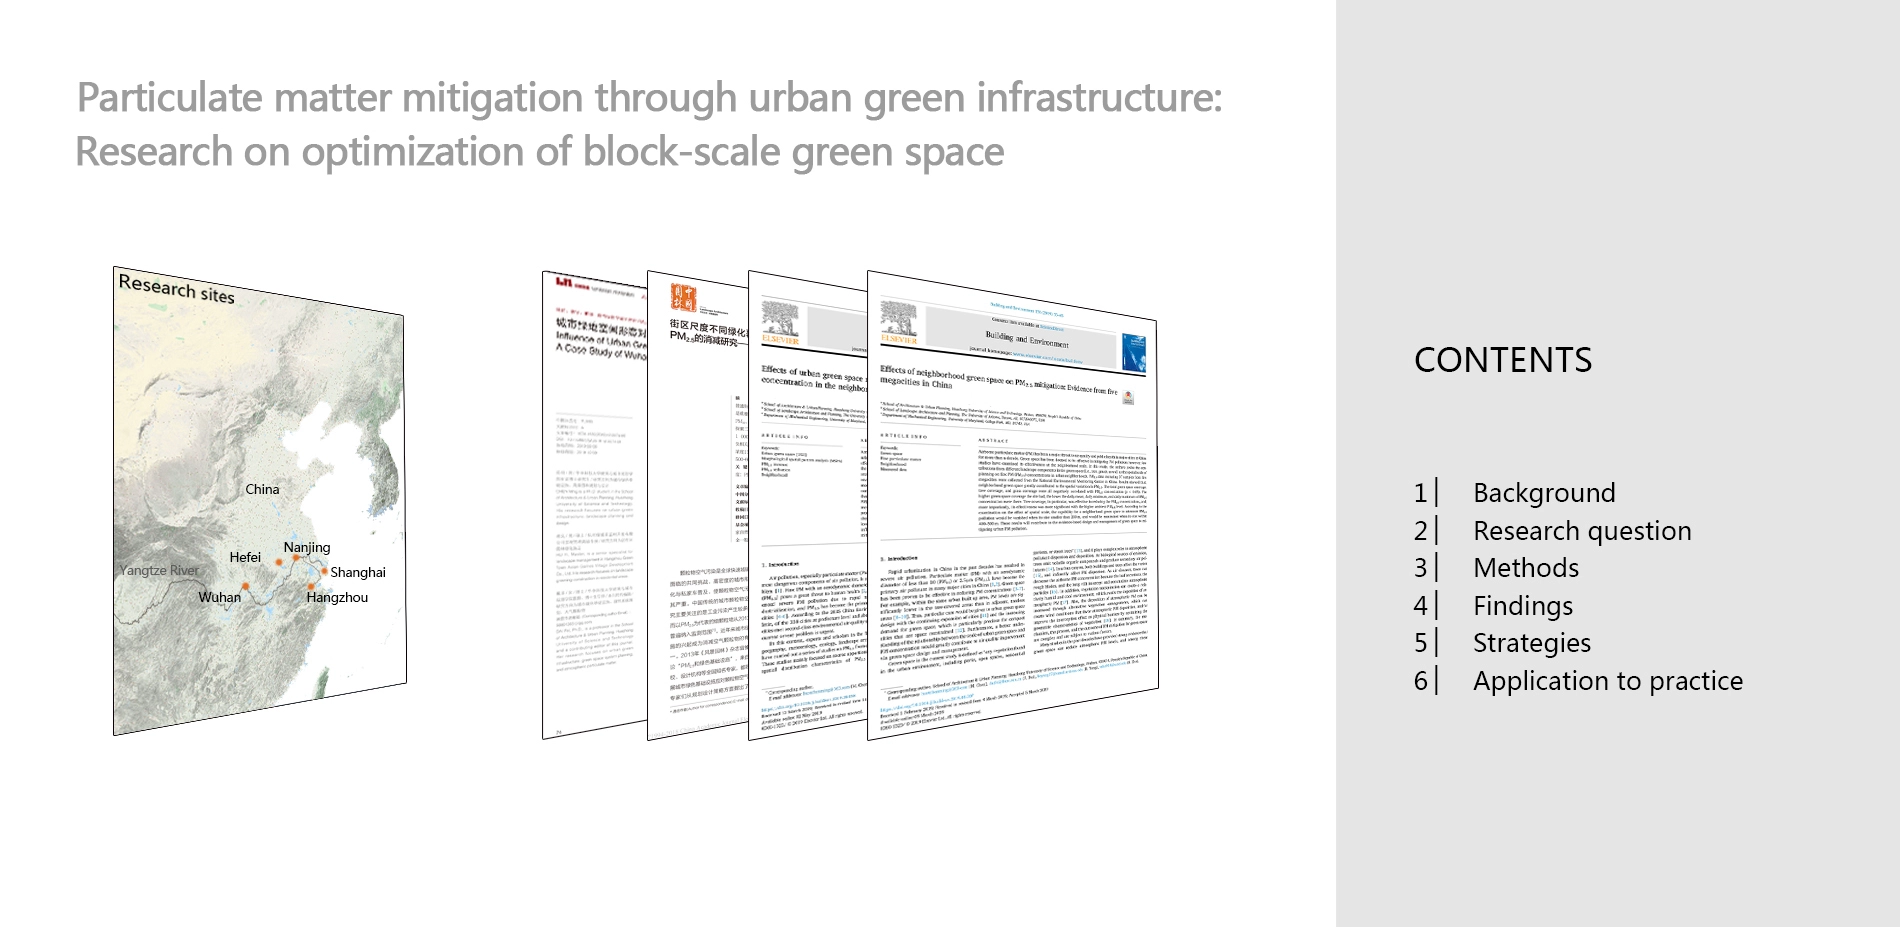
We used five provincial capital cities in the middle- and lower-reaches of the Yangtze River in China as the study sites. These cities are Hefei, Shanghai, Nanjing, Hangzhou and Wuhan, all of them are part of the hot-summer/cold-winter climate zone. In addition, these cities have similar built-up urban areas, landforms, and urban morphology, and suffer from similar levels of severity of air pollution. The readily available air quality monitoring stations across these cities also make them ideal for the analysis of green infrastructure and PM2.5 mitigation. After data screening and experimental controls of the sites, 37 typical urban blocks were selected to perform the statistical analyses, with green infrastructure size and spatial pattern being the primarily independent variables. A typical urban block is defined based on a grid of 1km × 1 km that has an air quality monitoring station located approximately on the center. Detailed procedures are elaborated below.
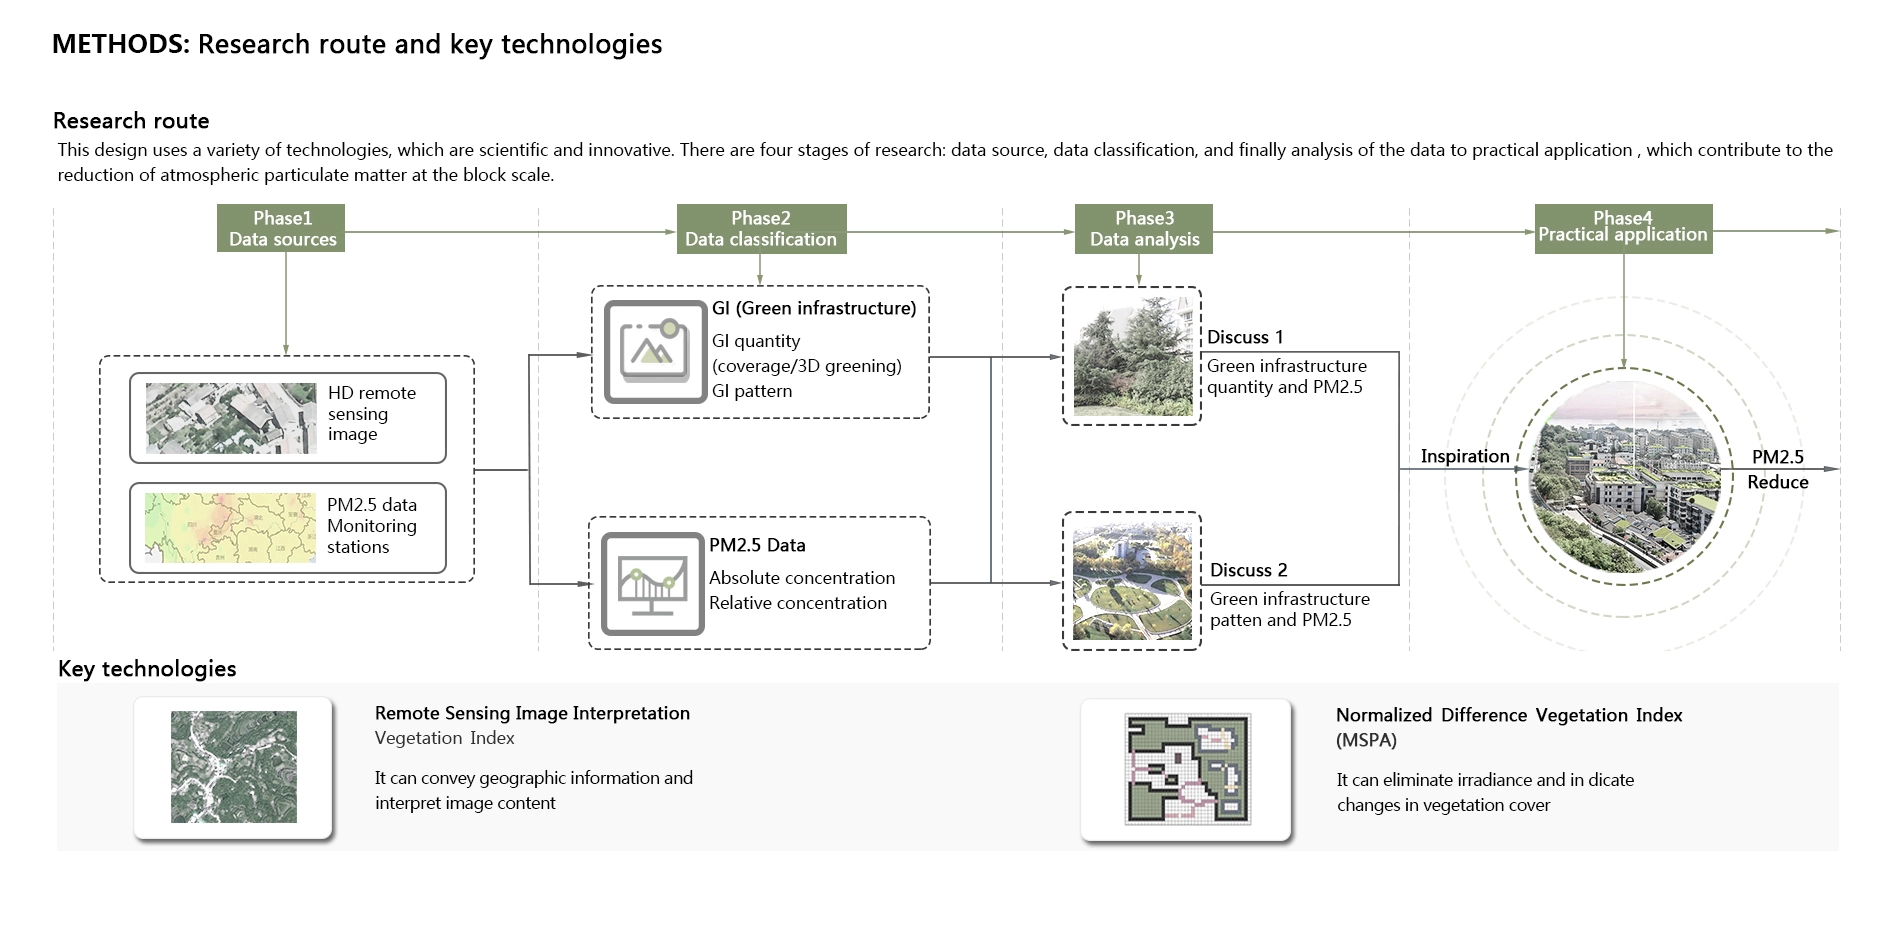
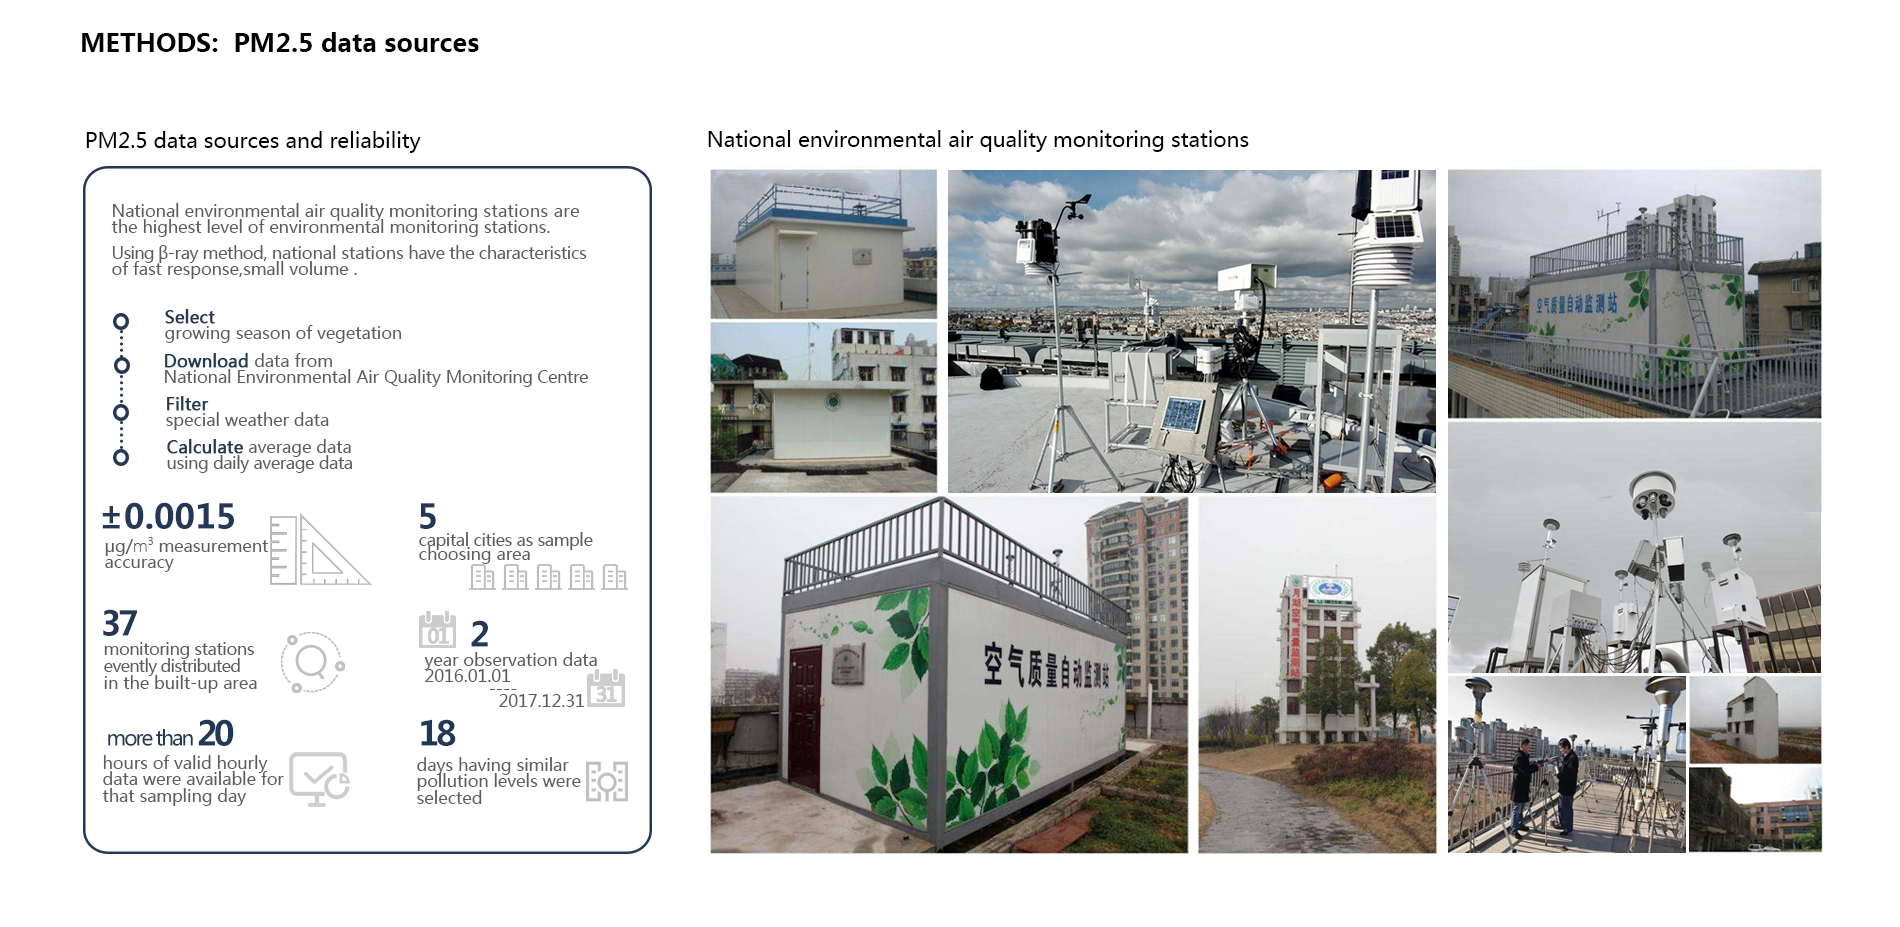
PM2.5: PM2.5 data in the form of hourly PM2.5 concentration are retrieved from the monitoring stations installed and operated by the China National Environmental Monitoring Center for two years. These stations provide an open access to high precision and abundant air quality data. PM2.5 data of the five cities are comparable for the analysis because they are measured based on the same standards, and three relative indicators (range, duration, and rate) are used to represent the changes of PM2.5 concentration.
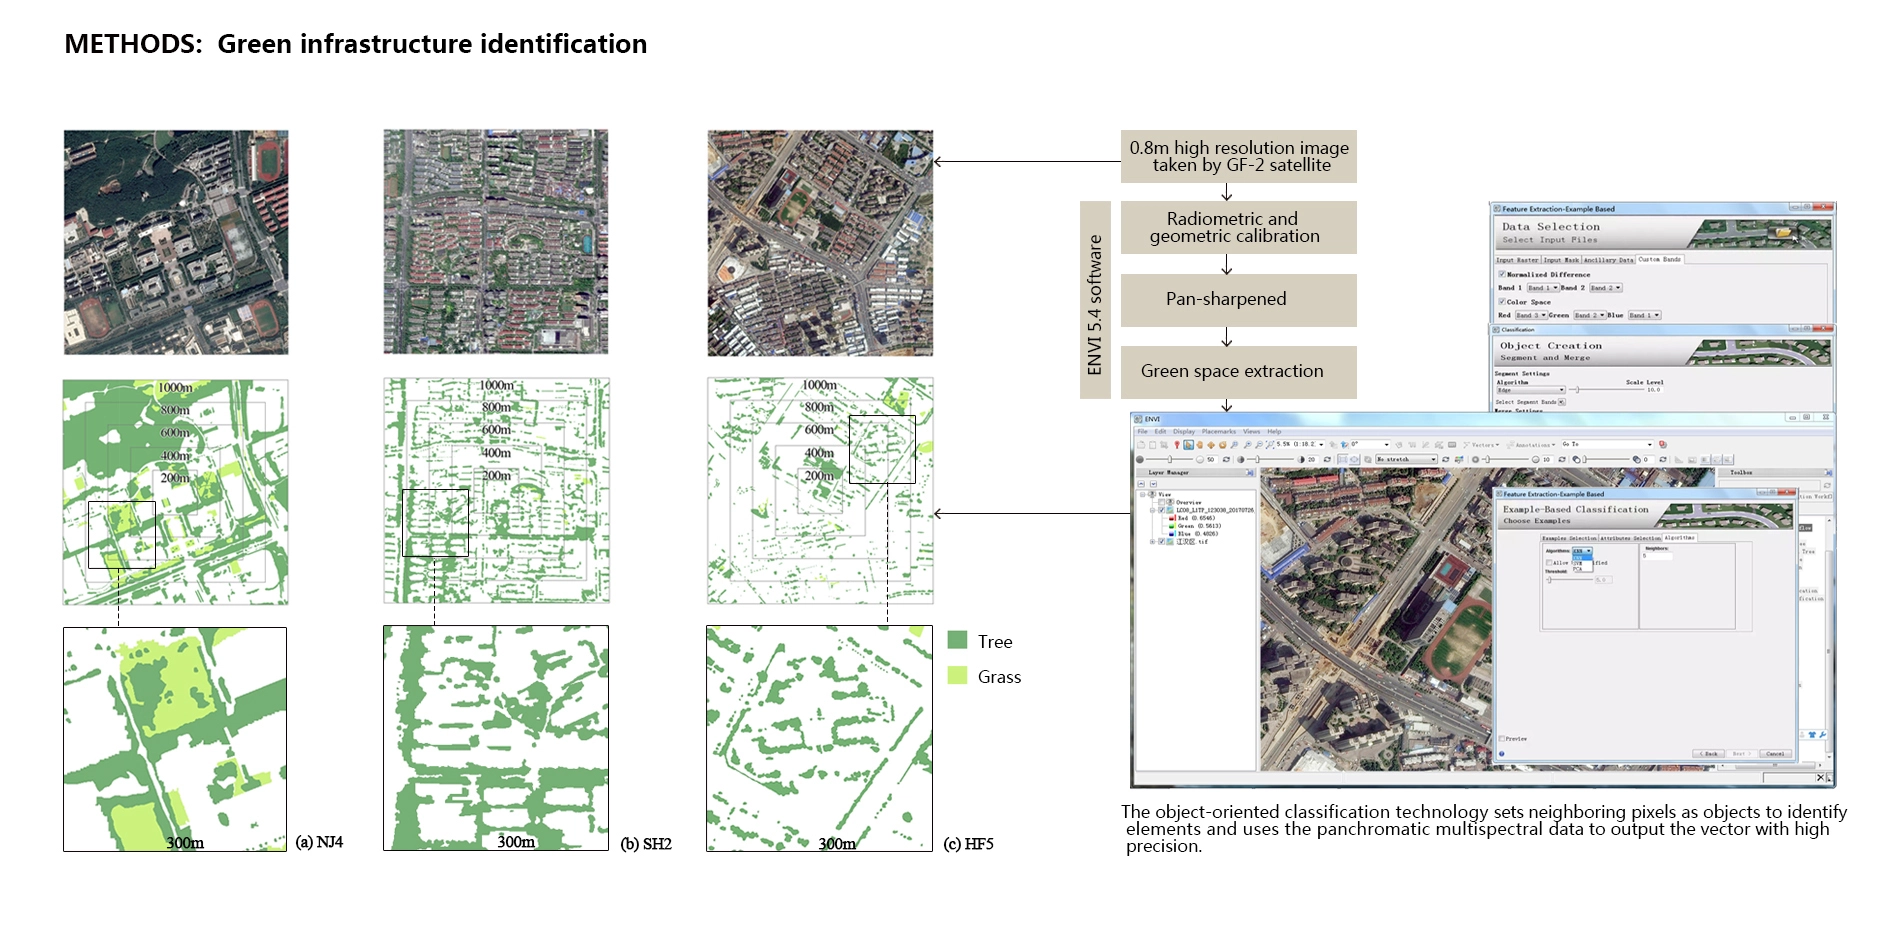
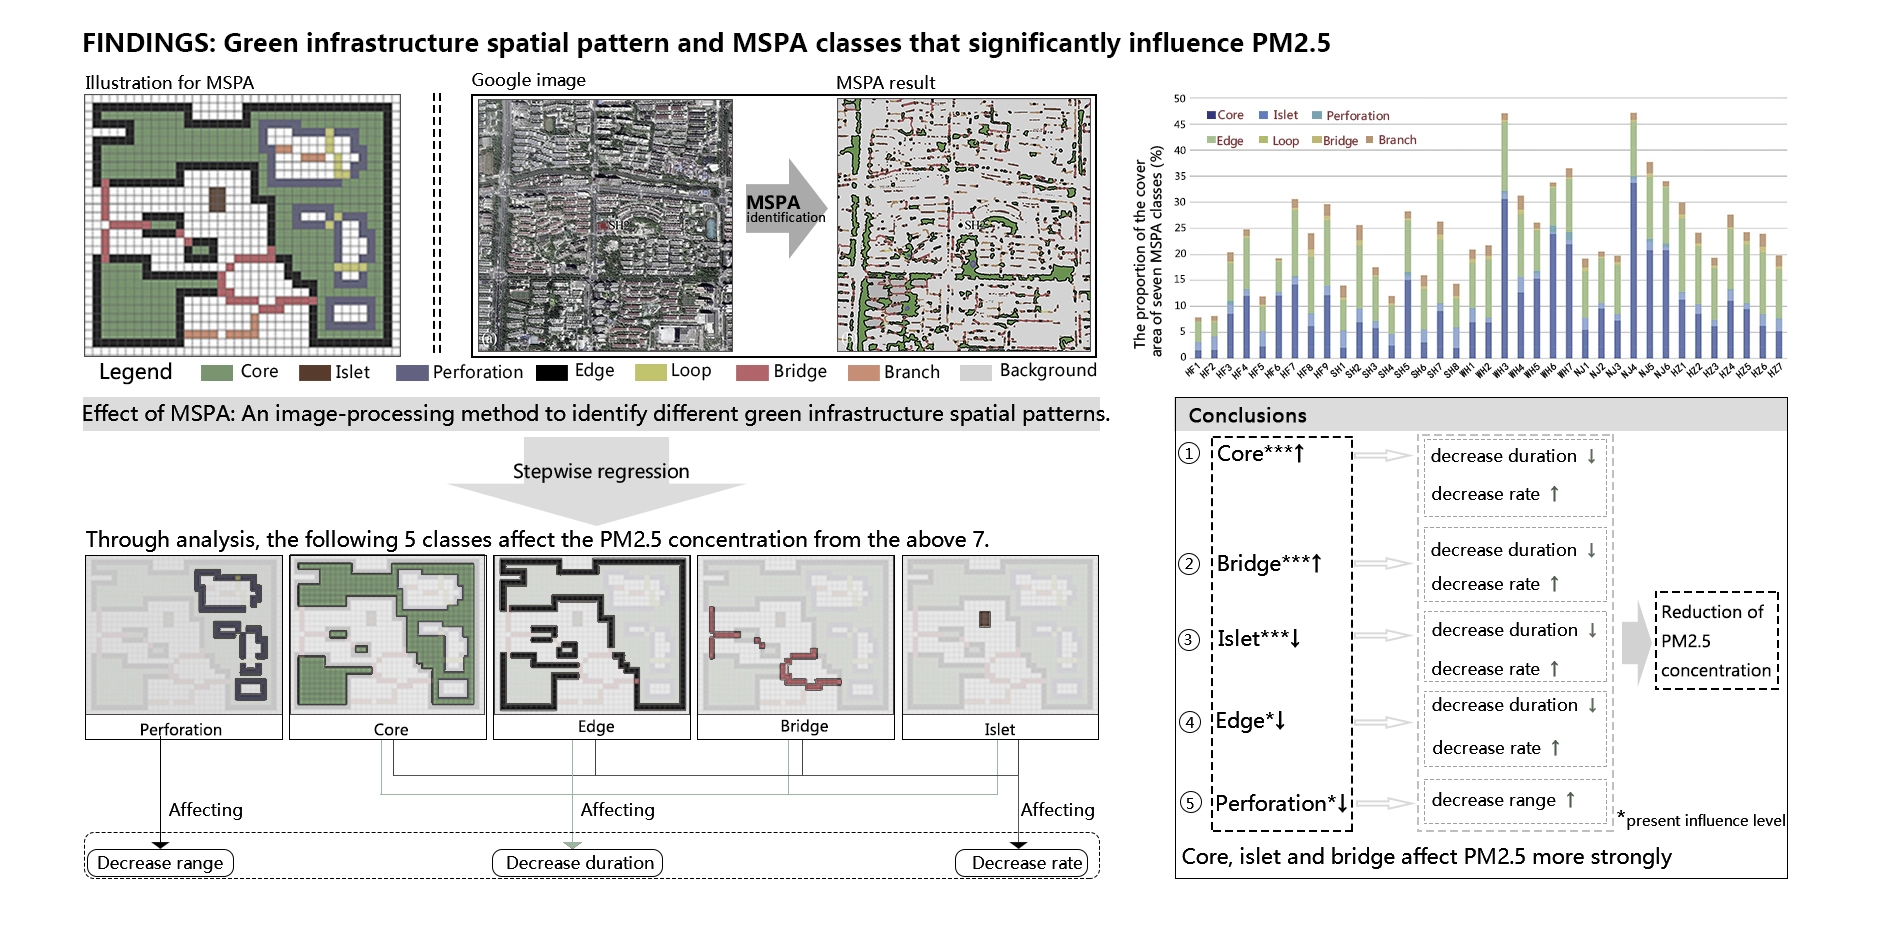
Scale and pattern of green infrastructure: Based on the 0.8m high-resolution remote sensing imagery, the quantity and spatial distributions of green infrastructure are identified. The green space coverage and the three-dimension (3D) greening are obtained via the object-oriented classification method and the remote sensing inversion method, respectively, which altogether represent the scale of green infrastructure adoption. Next, using the morphological spatial pattern analysis (MSPA) we visualized the spatial patterns of green infrastructure, which were overlaid against the urban fabric and were presented as seven pattern classes.
Quantitative analysis: Correlation analyses were conducted regarding the coverage of green infrastructure and PM2.5 concentration. Curve fitting analysis was used to ultimately define a possible threshold of green coverage that allows maximum green infrastructure performance. Through the stepwise regression analysis, the seven green infrastructure pattern classes and their relative contributions to PM2.5 concentration reduction are quantified.
3. Findings
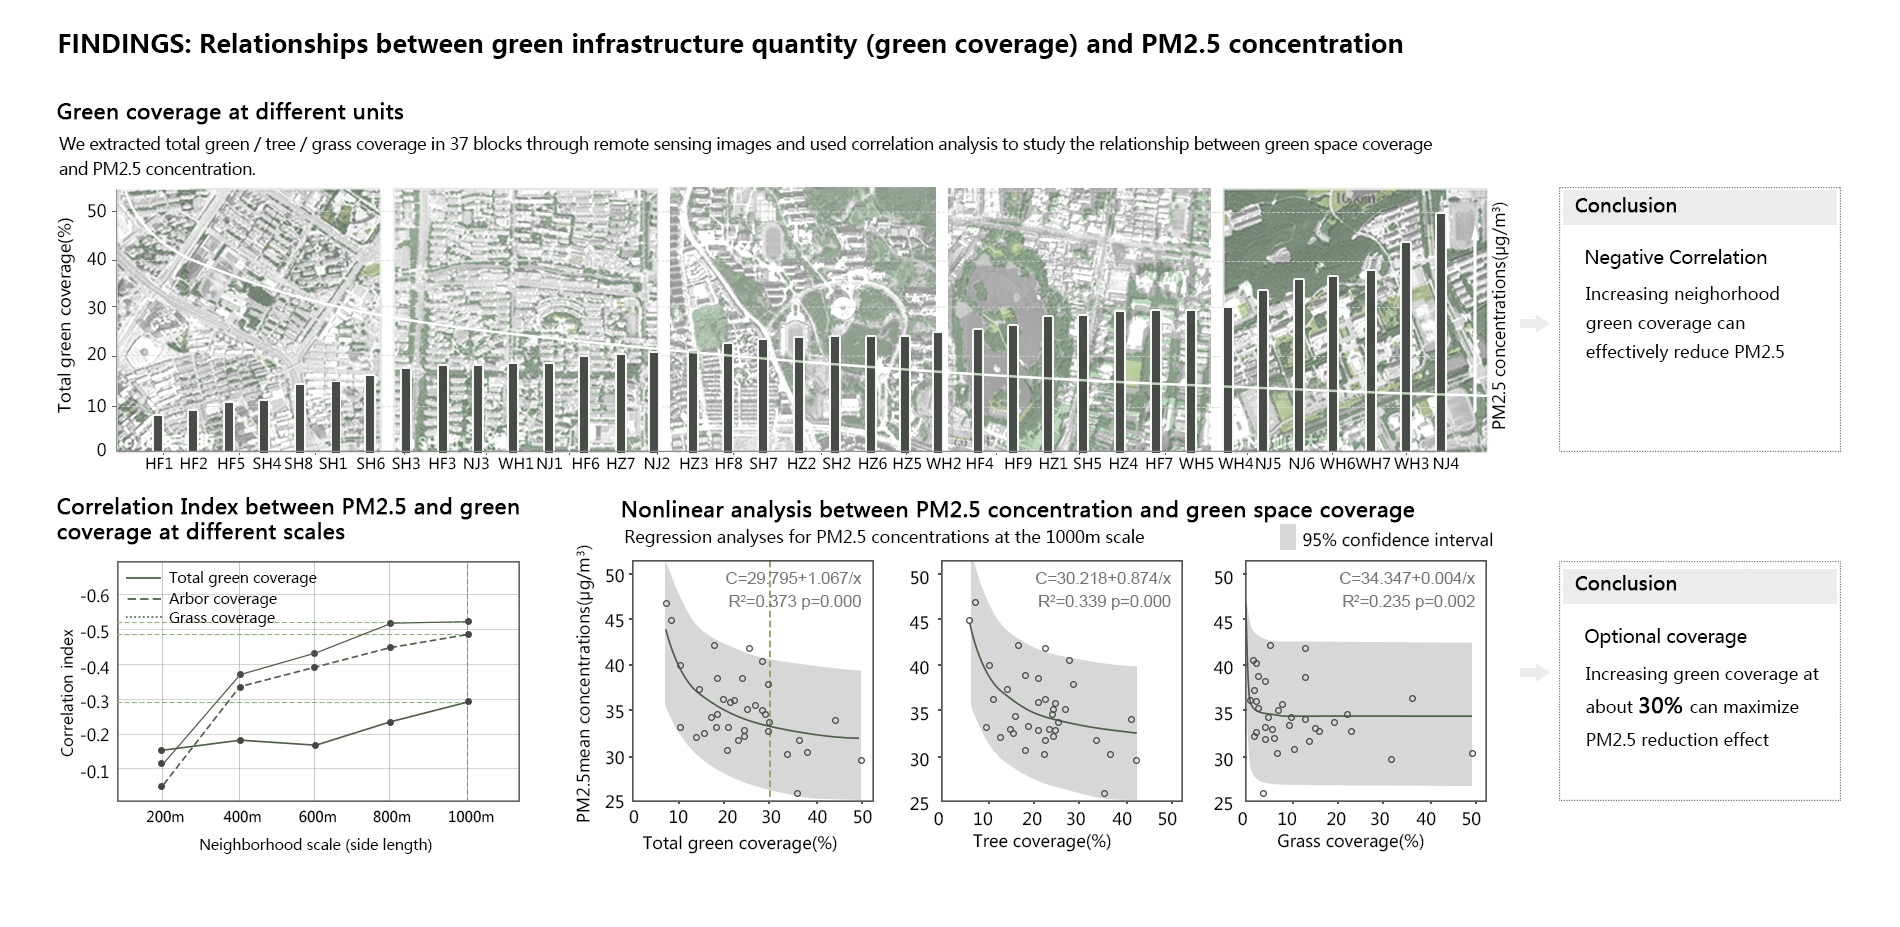
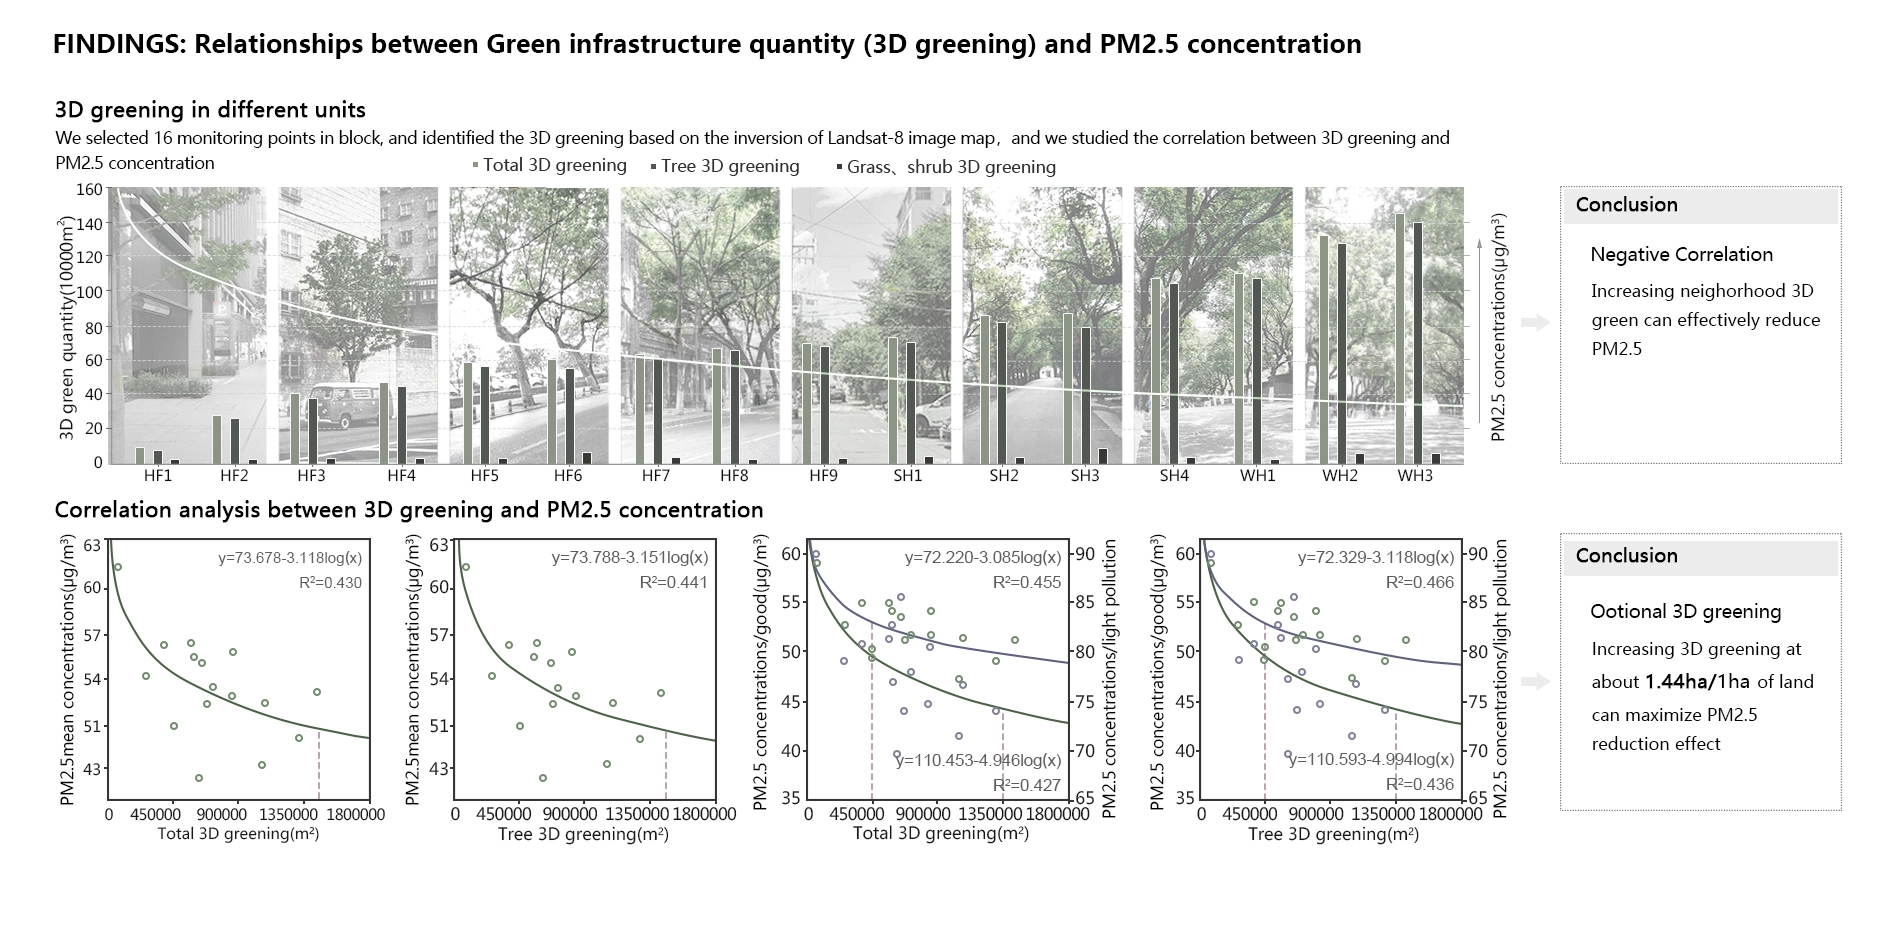
Relationships between green infrastructure quantity and PM2.5 concentration
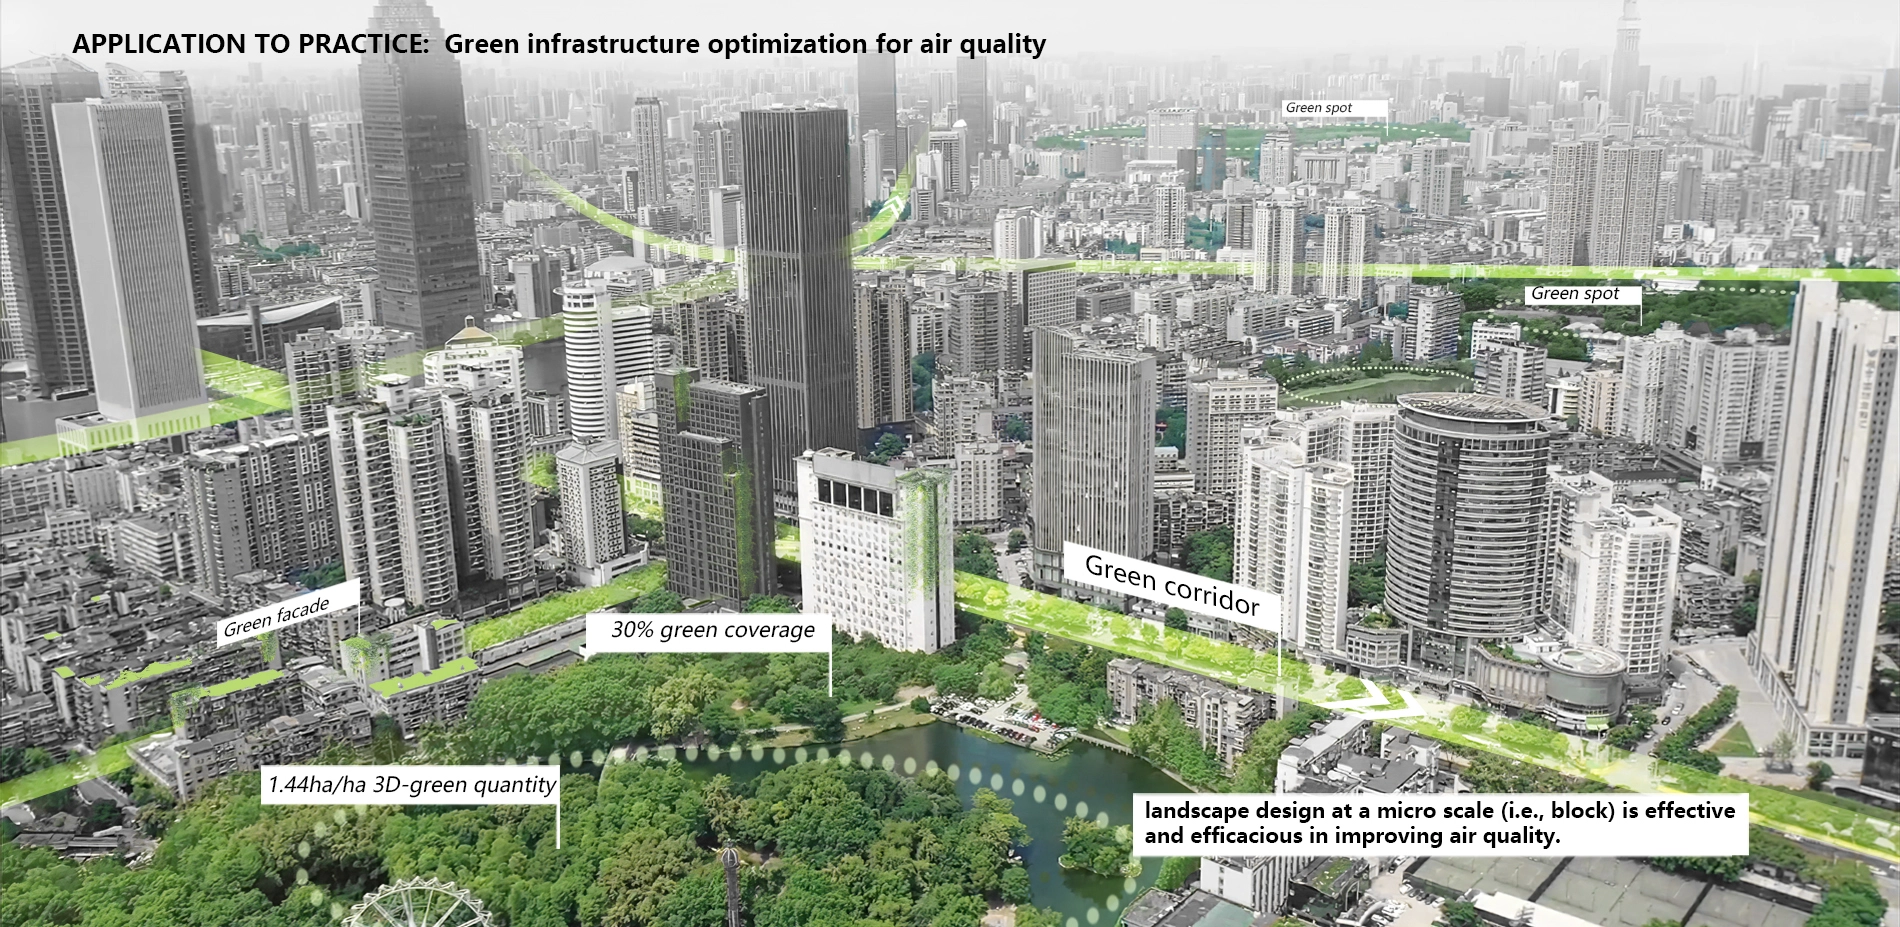
Increasing the block-scale green space coverage can effectively reduce PM2.5 concentration; the maximum reduction effect occurs when the green space coverage increases to approximately 30%. Increasing the block-scale 3D greening can effectively reduce PM2.5 concentration; increasing 3D greening density to about 1.44 ha per hectare land area can maximize the reduction effect.
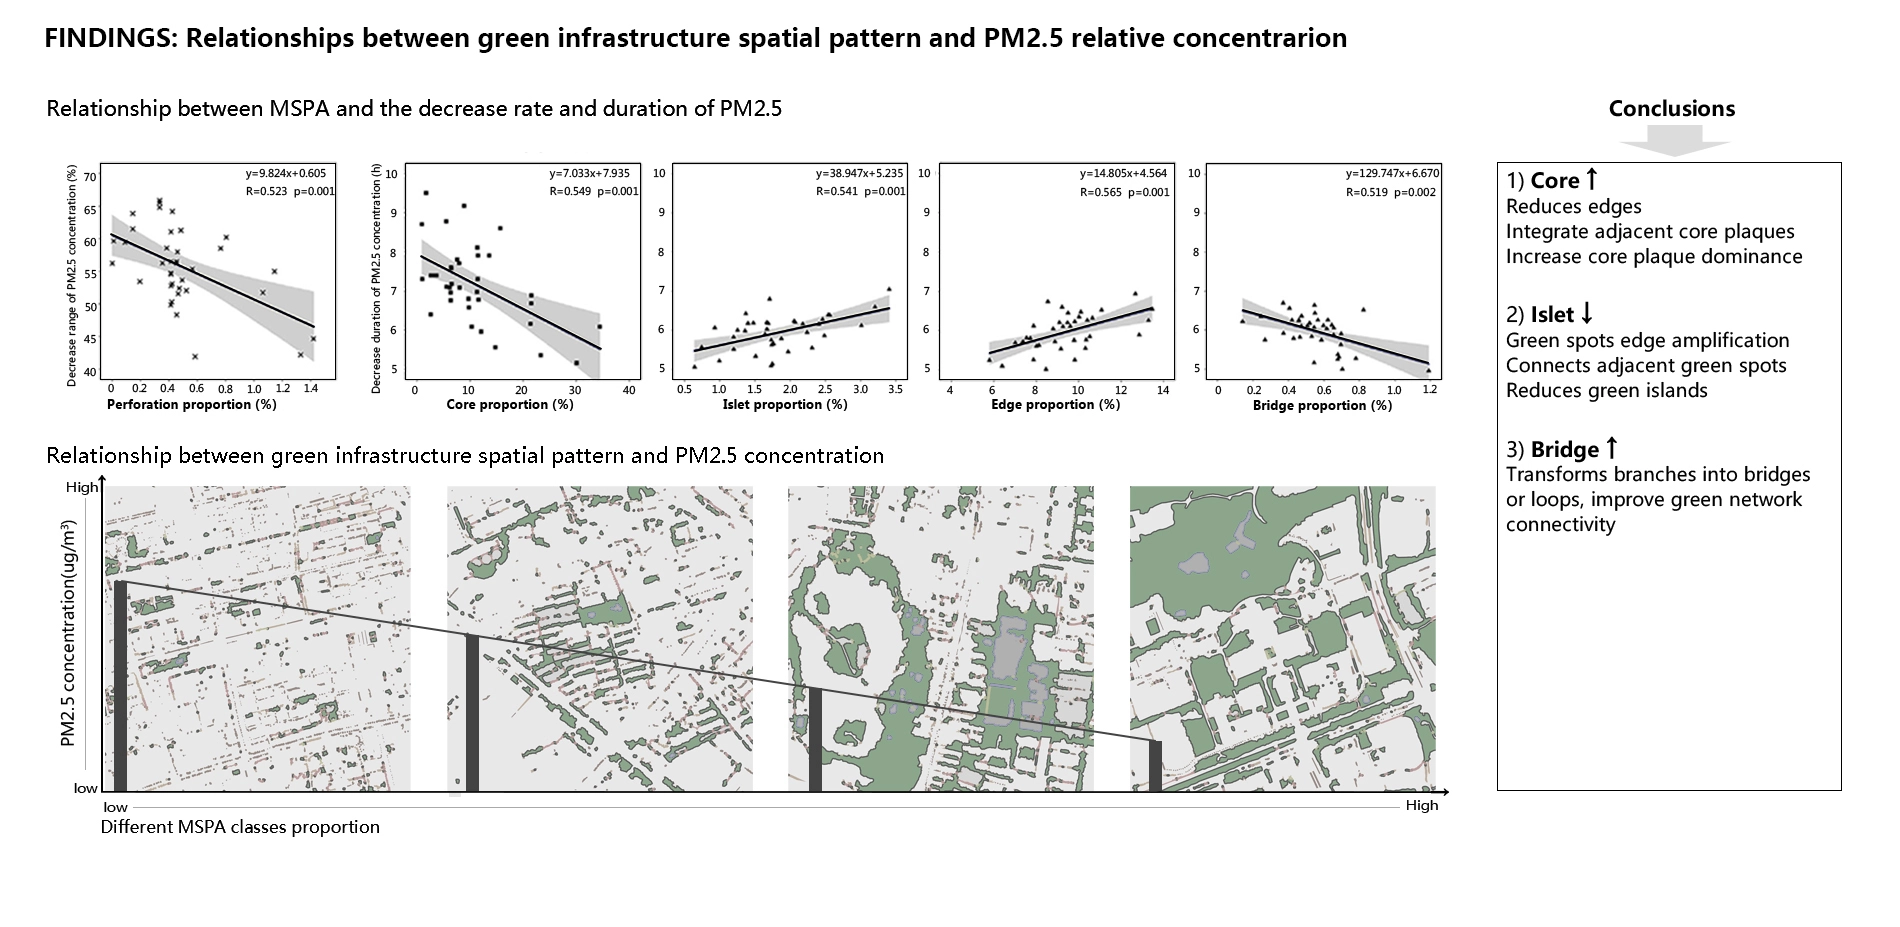
Relations between Green infrastructure spatial pattern and PM2.5 relative concentration
Through the analysis of seven MSPA classes, we found that five of them can significantly reduce PM2.5 concentration, and among these the core, bridge, and islet have the strongest impact. Increasing the proportions of the core and bridge classes can decrease PM2.5 concentration. Decreasing the proportion of islet class can also decrease PM2.5 concentration.
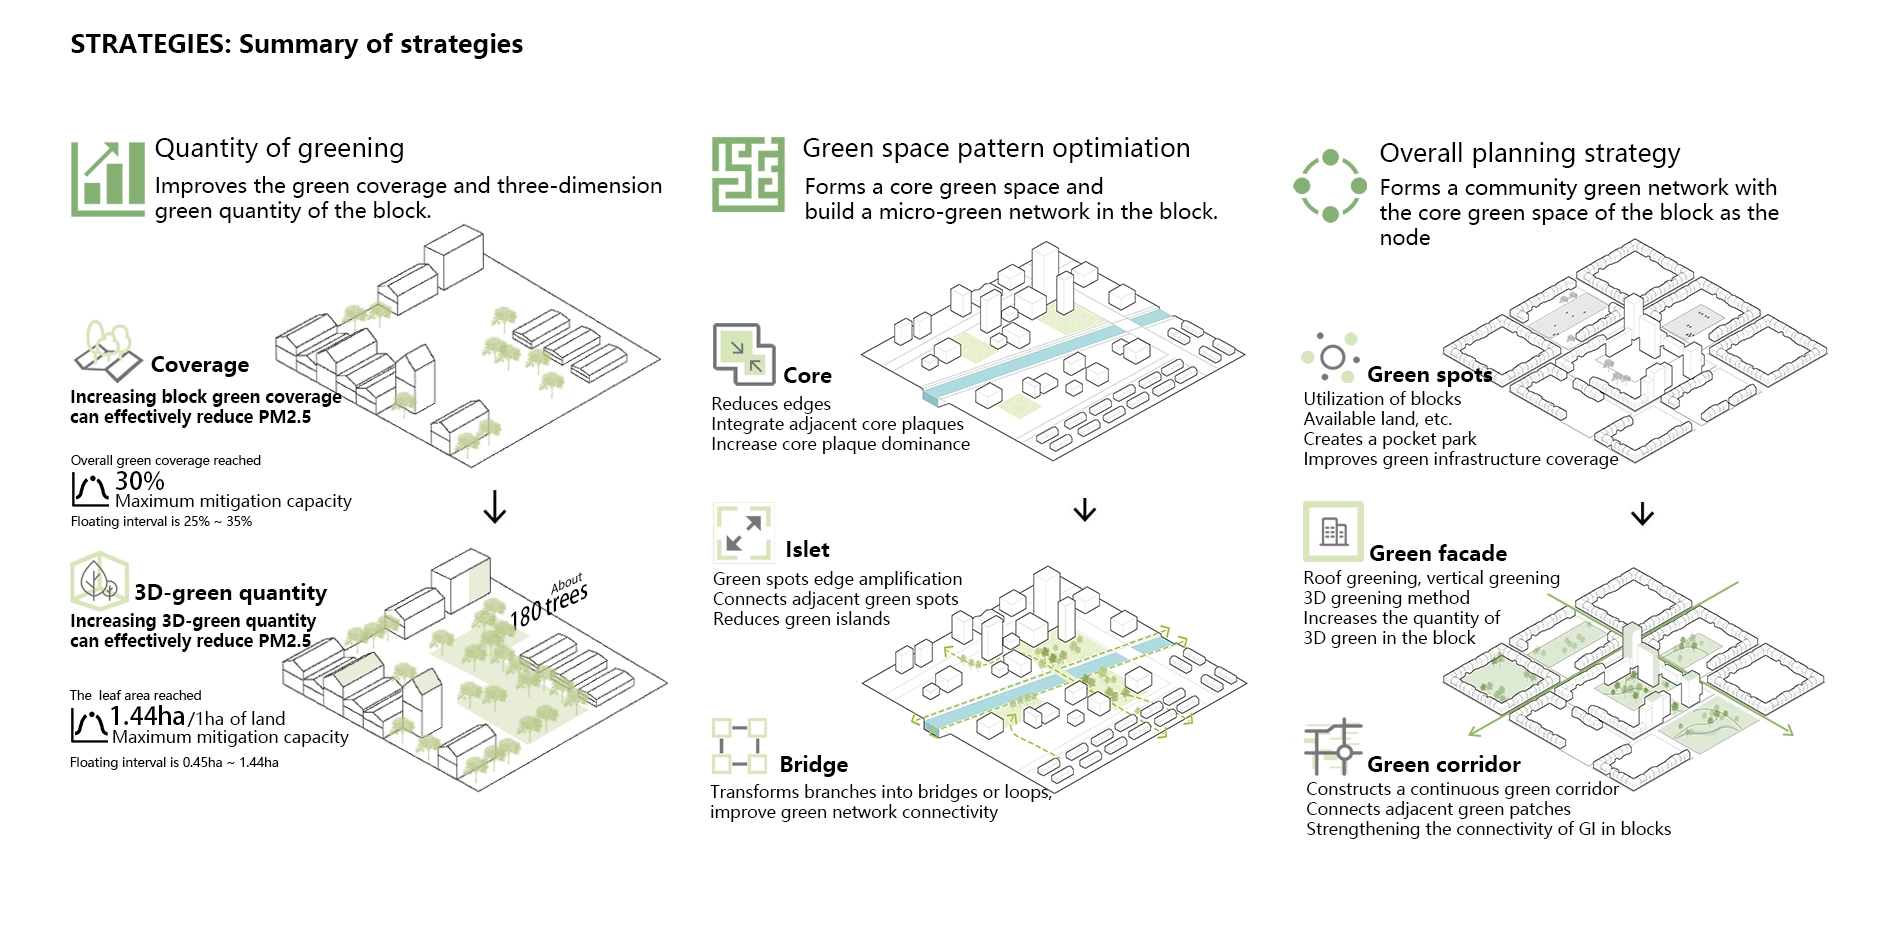
4. Summary of design strategies
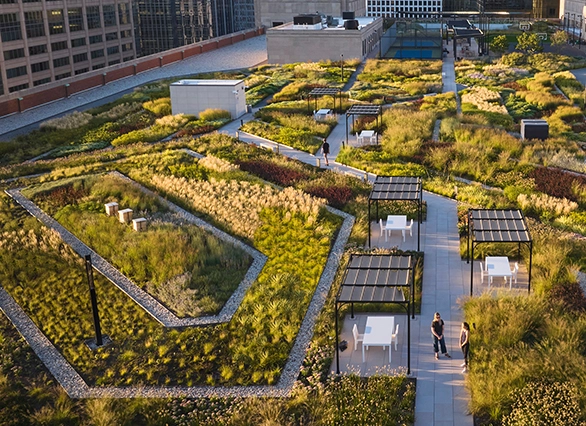
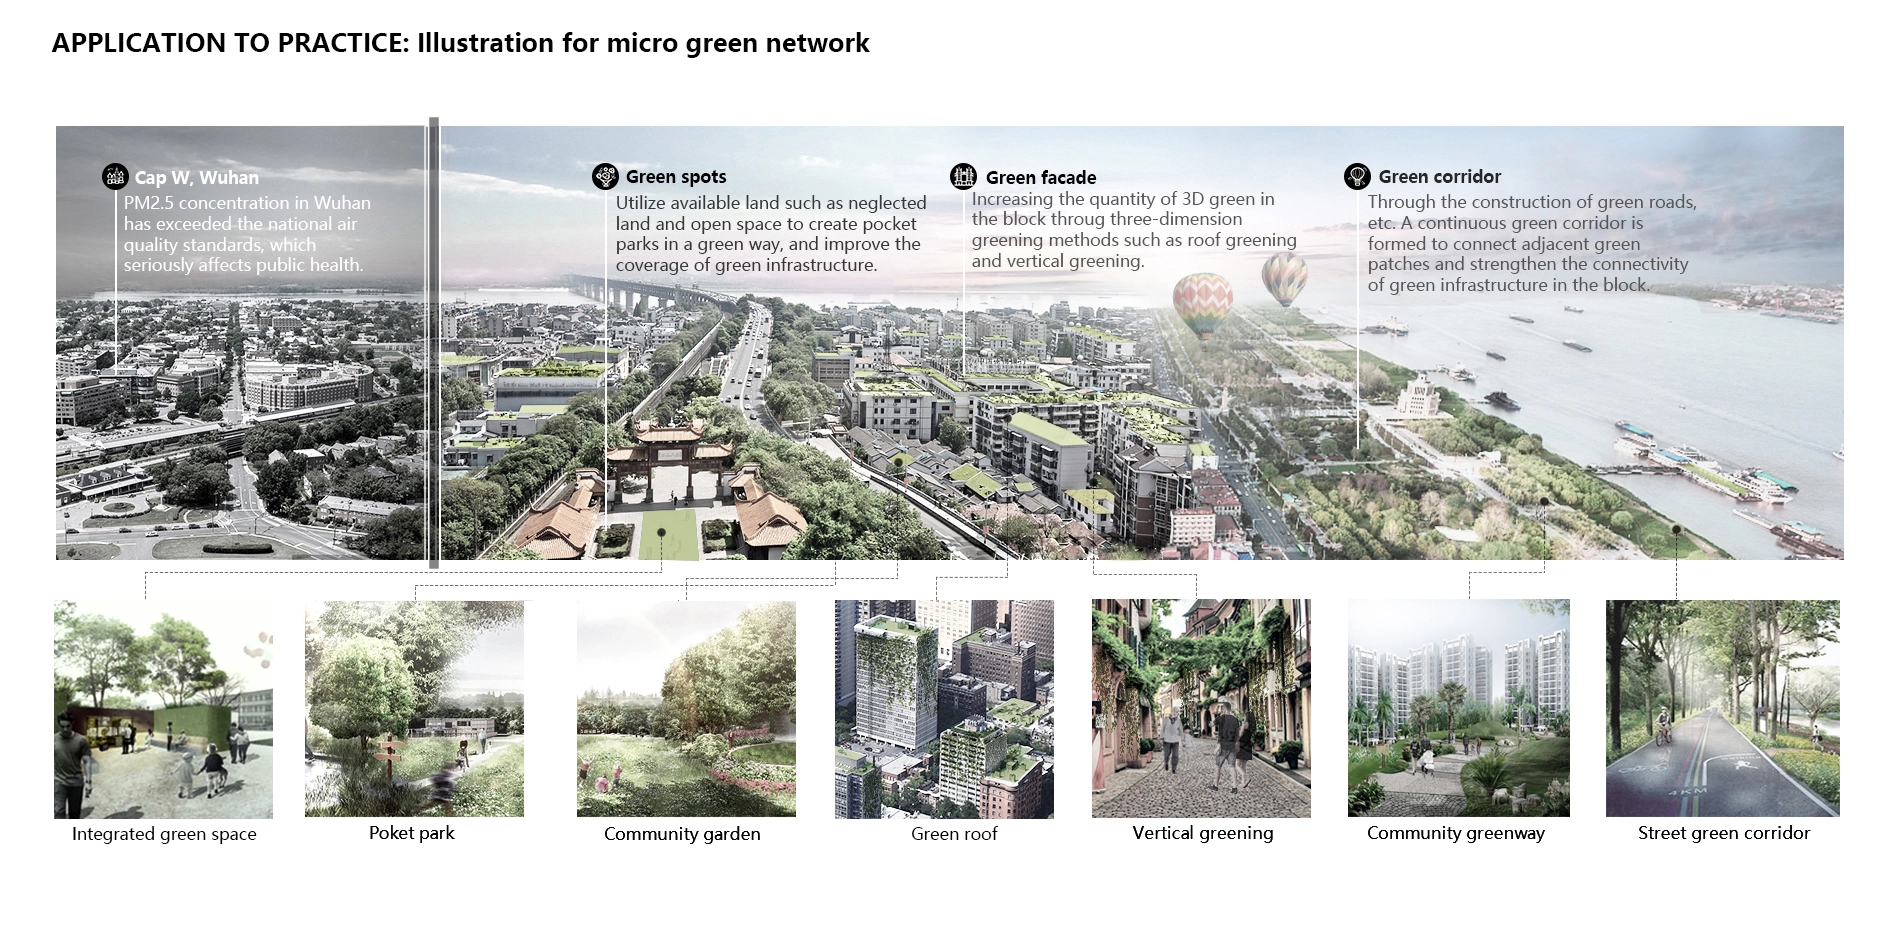
Three operational strategies are proposed based on this current research. (1) Create pocket parks through retrofitting vacant land, idle land, and other available land areas at the block scale to innovative green infrastructure designs; (2) Increase the 3D greening of urban blocks through roof greening, vertical greening, and other green facade; (3) Improve connectivity of green infrastructure in urban blocks through stitching adjacent green patches and make them continuous green corridors and greenways.
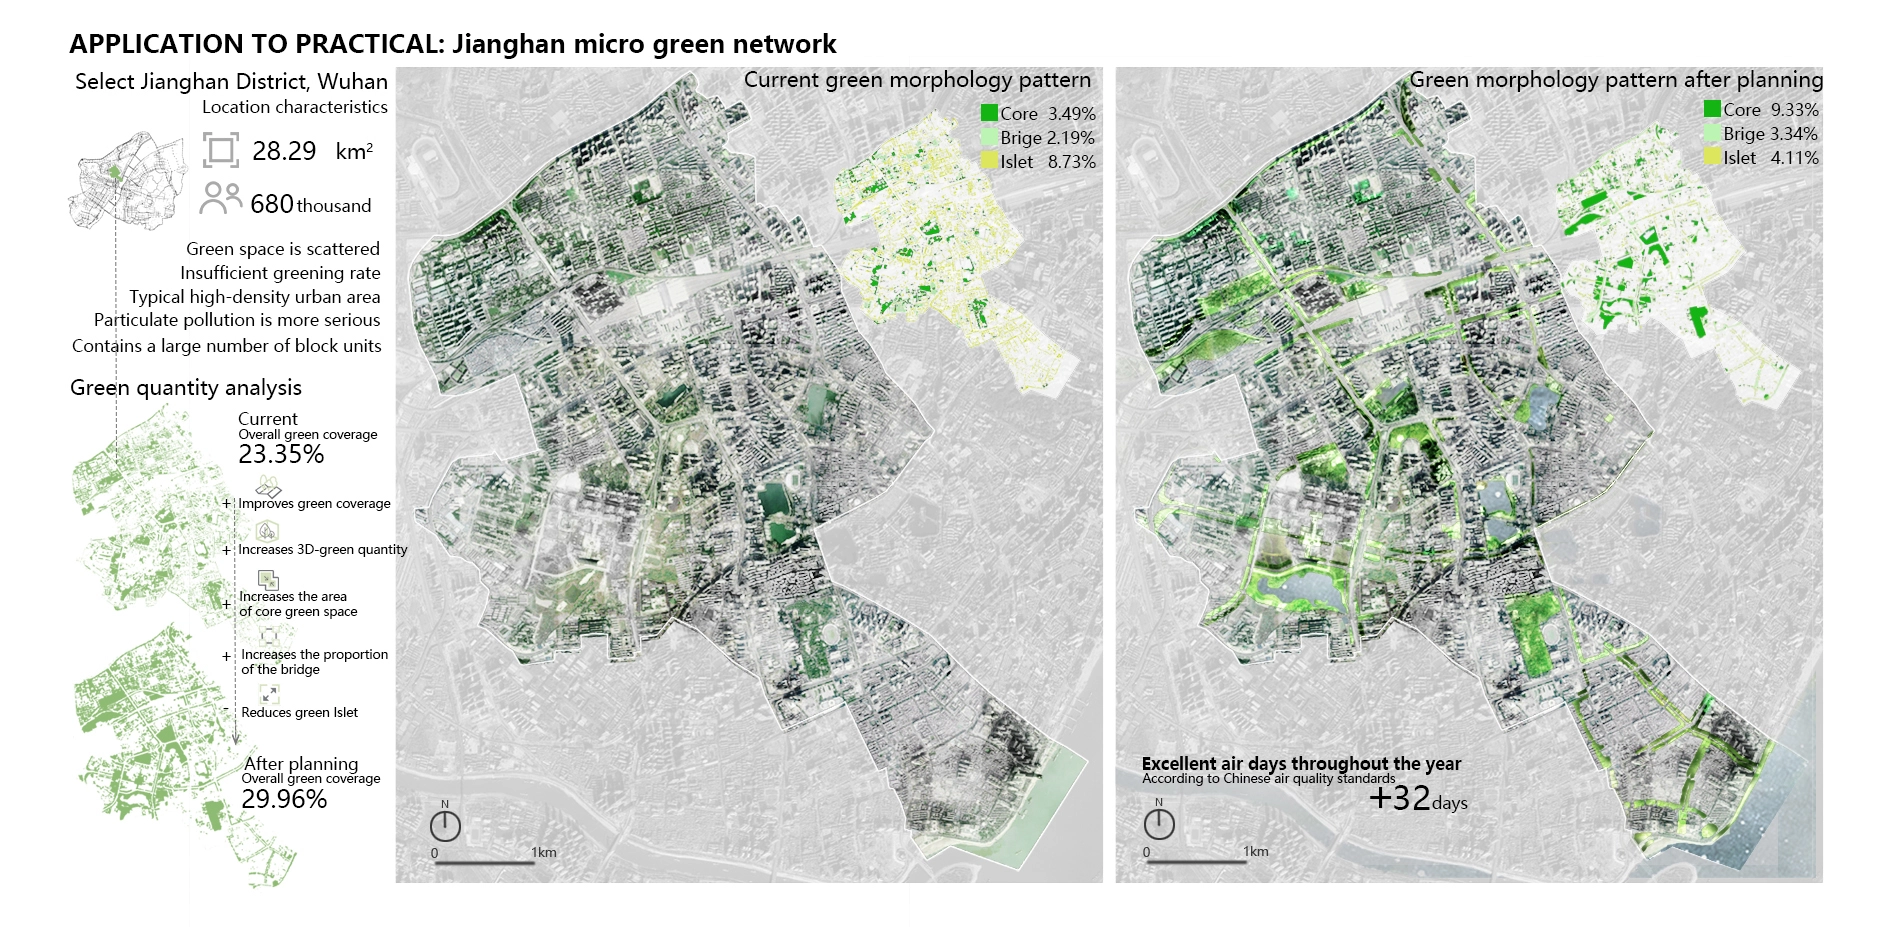
5. Project application based on research findings
Jianghan District, Wuhan, has a total area of 28.29 square km and a population of 680,000. This district is a typical snapshot of the old city in Wuhan that suffers from serious air pollution. The district contains extensive urban block units; current green infrastructure is limited and yet, highly fragmented. Following the analysis of the green infrastructure coverage percentage and the 3D greening and MSPA classes, we used the design strategies derived from the research and proposed the construction of greenways, making full use of the idle land areas for greening and increasing roof greening and vertical greening. The green space coverage has increased from 23.35% to 29.96%. Specifically, the proportions of the core MSPA class increased by 5.84%, the bridge MSPA class increased by 1.15%, and the island MSPA class reduced by 4.62%, respectively. Modeling analysis shows that the number of days reaching standard is expected to be in creased by 32 days.
6. Significance
Through analyzing the quantity (e.g., area) and quality of green infrastructure design (e.g., spatial configuration) in five metropolitan areas in China, we correlated landscape design metrics with long-term air quality monitoring data and developed optimized green infrastructure design strategies that can provide salient benefits of PM2.5 mitigation. In summary, this study provides strong evidence that landscape design at a micro scale (i.e., block) is effective and efficacious in improving air quality, and the research products can be used by other countries that face similar air quality challenges. -
- Fei Dai - Researcher
- Ming Chen - Researcher
- Bo Yang - Designer
- Peiyuan Sun - Designer
- Lu Ding - Designer
- Jiafeng Wang - Designer
- Wenpei Li - Designer
-
- Magnolia
- Fragrans
- Cedar
- Privet
- Ginkgo
- Hibiscus
- Camphor
- Boxwood
- Sycamore
- Locust
Advertisement
Related Awards
Honor Award, Research
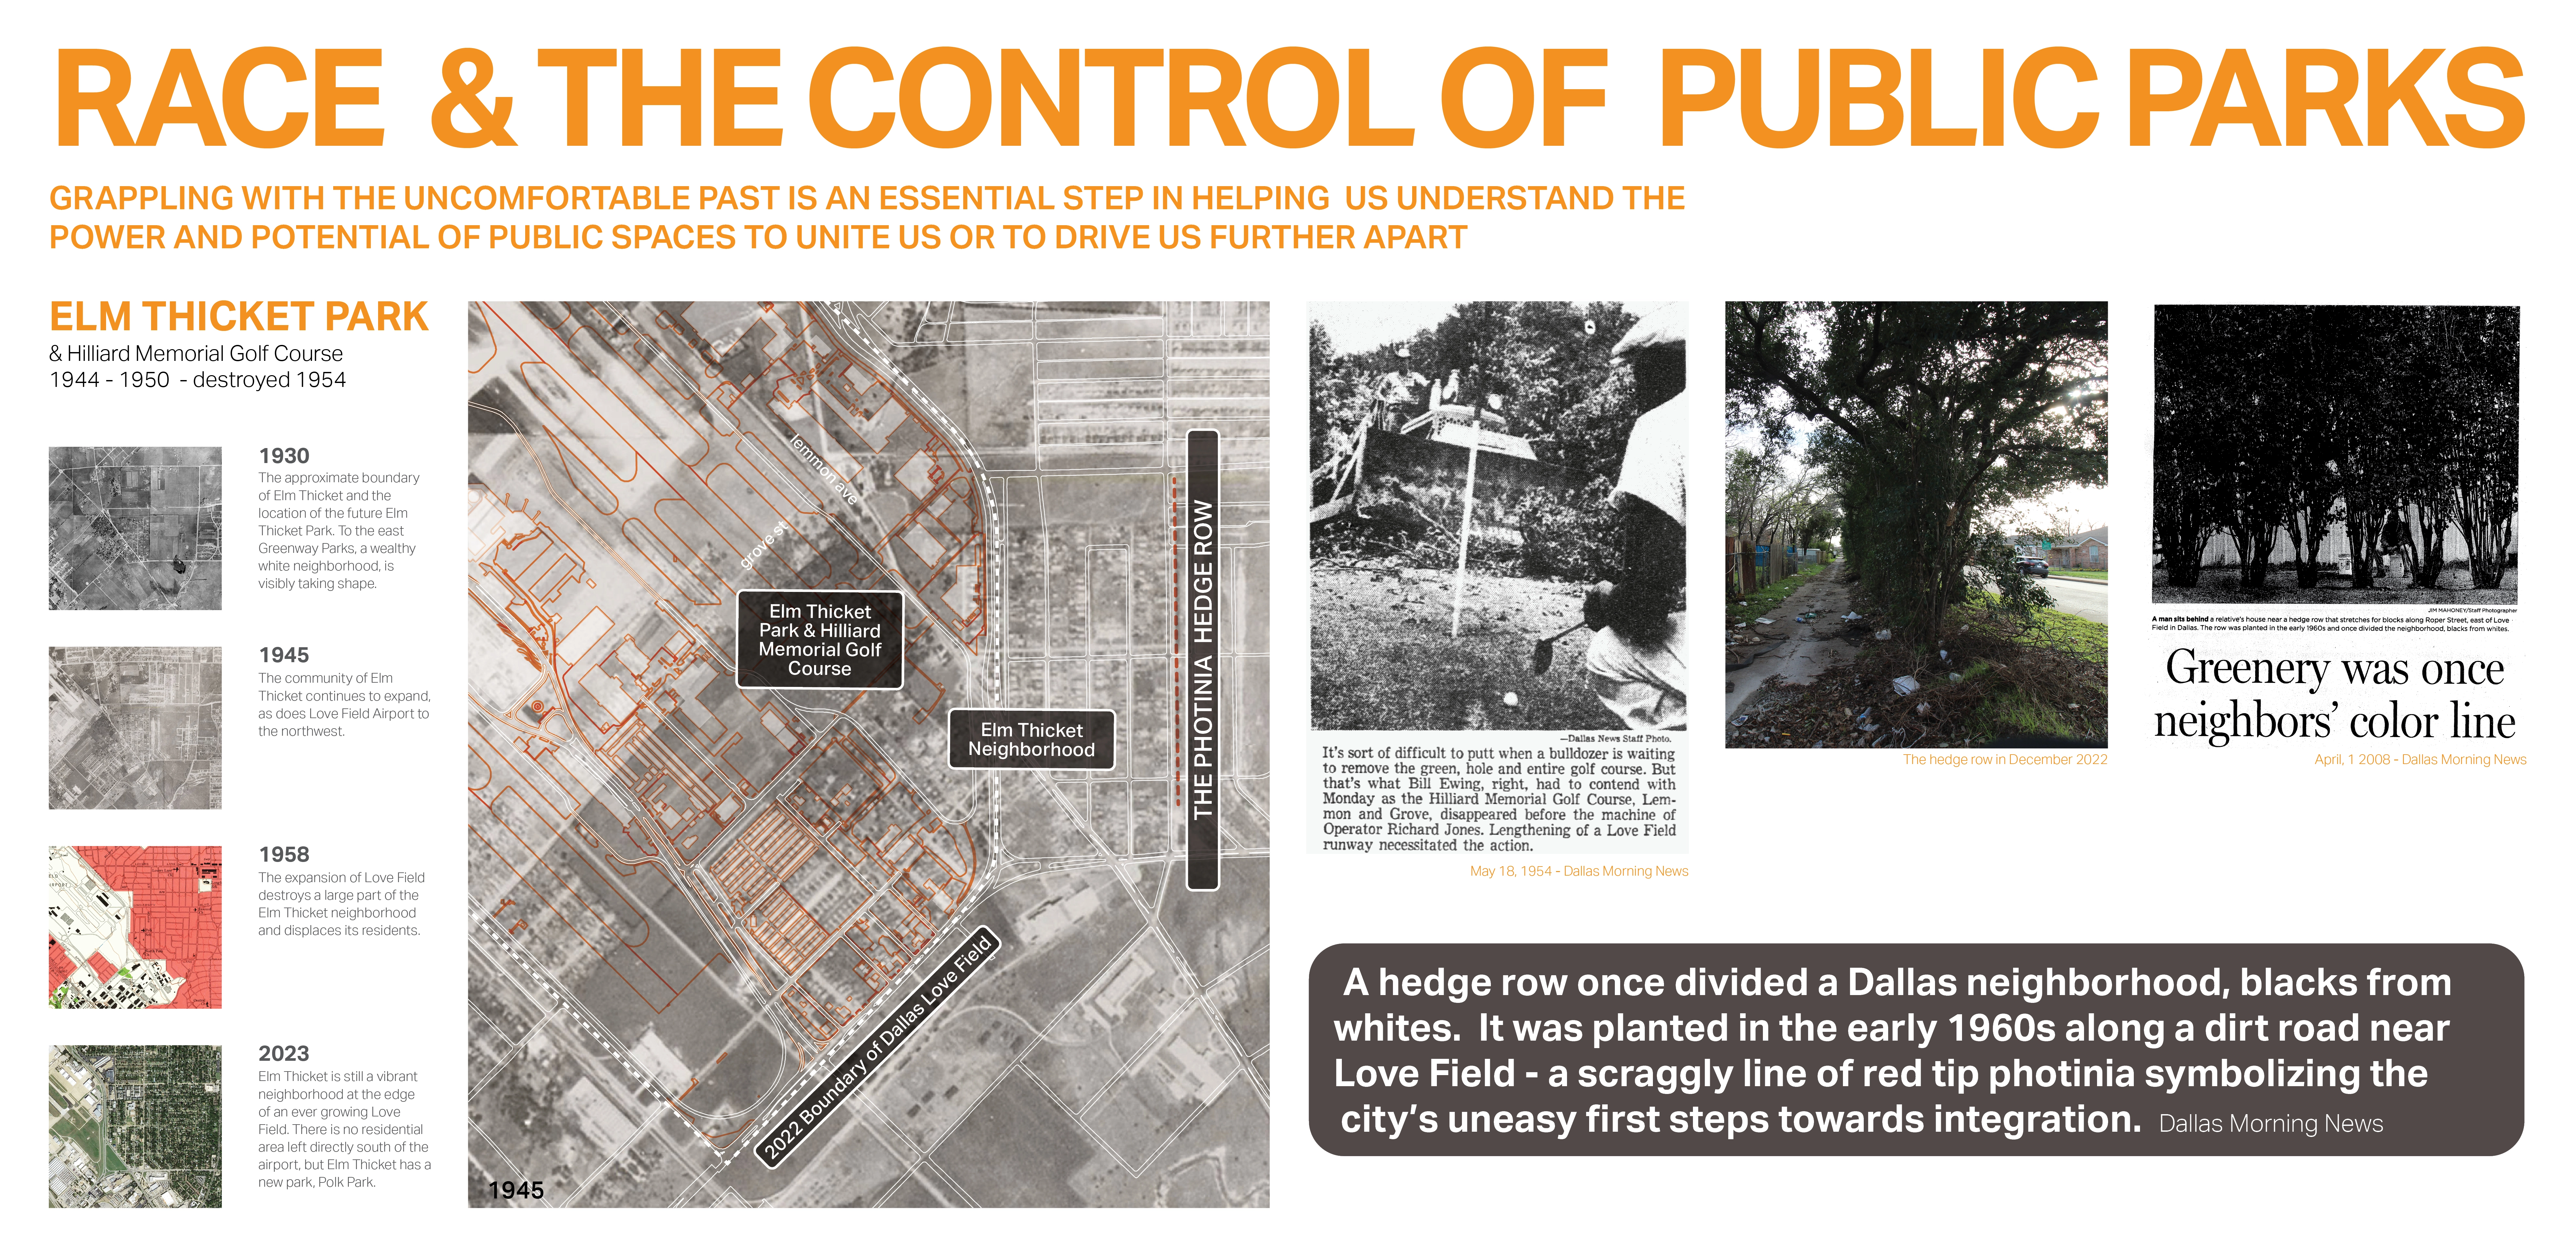
Race and the Control of Public Parks
This research uses a century long historical analysis of the public park system in Dallas, Texas, USA to uncover the physical and psychological ways in which public landscapes and the works of landscape architects have segregated urban spaces and how we might fight against these design practices. Through reframing past practice this work seeks to create a method for informing design thought and practices that seek to create a more just built environment.